v66.1.0: Joly Jumanji Goosebumps
Weekly release issued on May 7th, 2020.
Highlights
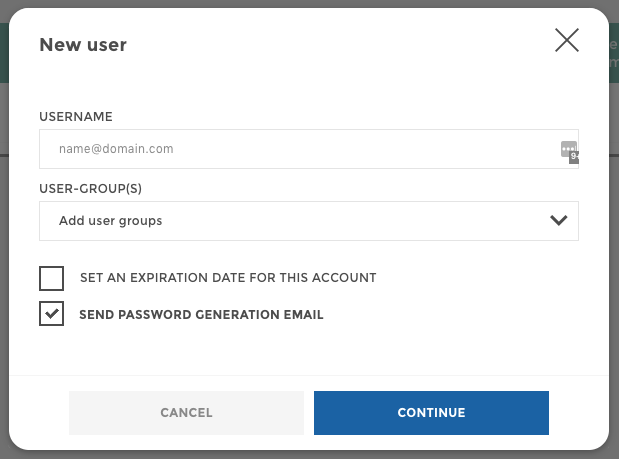
Create users with no password
With this week release, we introduce the capability to create a user without having to create a temporary password. This works if you choose to send them a generate email password.
New features
Data Storytellers
- Charts :: Linechart :: Implement showValues on new Linechart
- Charts :: Linechart :: Implement sentiment zones on new linechart
- Charts :: Linechart :: Add case for ‘Add events from a column of current dataset’
- Charts :: Linechart :: Implement dashedLines option on new linechart
- Charts :: Linechart :: Add zeroBaseline value on Yaxis
- User management :: Creation :: Create user without a password
- Data :: Permissions :: Permission editor preview switch on / off
- Data :: Permissions :: Display error message when dataset has too many rows
- Data :: Permissions :: Create permissions that apply to all users
End-users
- Data :: Export :: Export story data in excel format
Bug fixes
Data Storytellers
- Grid views :: Executive Summary :: Fix chart display in layout
- Data :: VQB :: Remove date edition when the vqb is not initialized
- General :: Studio :: Display error messages from etl config validation
- UX :: Studio :: Fix chart’s resize when another chart is added
- UX :: Studio :: Fix modal display
- UX :: Studio :: Center action buttons of the commentary
- Charts :: Barchart :: Display sentiments automatically
- Data :: Permissions :: Handle array or value in descriptions
- Exports :: Fix usage of a dedicated field for views in URLs
- Data :: Permissions :: Always display default permission
- Charts :: Bullet :: Add similar color for chart and tile
End-users
- Grid views :: Datawall :: Hide datawall button on mobile devices
- Grid views :: Executive Summary :: Fix multiple senders UX
- Grid views :: Executive Summary :: Fix the download execsum on mobile
- Grid views :: Executive Summary :: Fix execSum download naming
- Charts :: Linechart :: Fix value color
- Charts :: Linechart :: Align the desktop right margin on the mobile display
- Presentation Mode :: Prevent tutorial from showing in prez mode
- Charts :: Bullet :: Fix value icon
- UX :: Charts :: Fix initial alignment for barchart and barlinechart
- UX :: Charts :: Fix cropped stacked barchart on mobile
- UX :: Charts :: Fix leaderboard average display
- UX :: Tiles :: Fix pdf tile display
New documentation available
- News entry points in the doc, check it out in the “How to create apps” section