How to :: pin markers on a map
Overview
This tutorial explains how to pin information on a map with the markers configuration.
You want to create a mapchart displaying population for a few european cities? Let’s do a mapchart with markers.
💡 This could be very useful if you’d like to show your shops on a map
Step1 : Define your data
First, you need a dataset with what you’d like to show on your map. In our example, the list of each city and its population figures.
Therefore, in your data explorer, you should have a dataset like this:
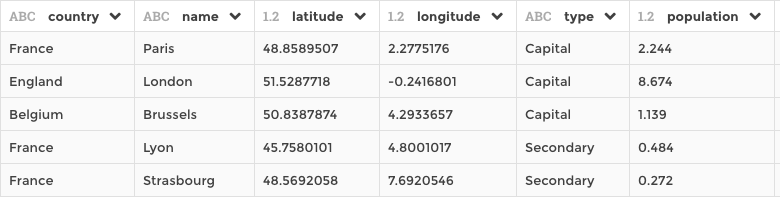
Important
👉 latitudeand longitude are mandatory, while country,
name, type and Population are optional.
Step2 : Chart parameters
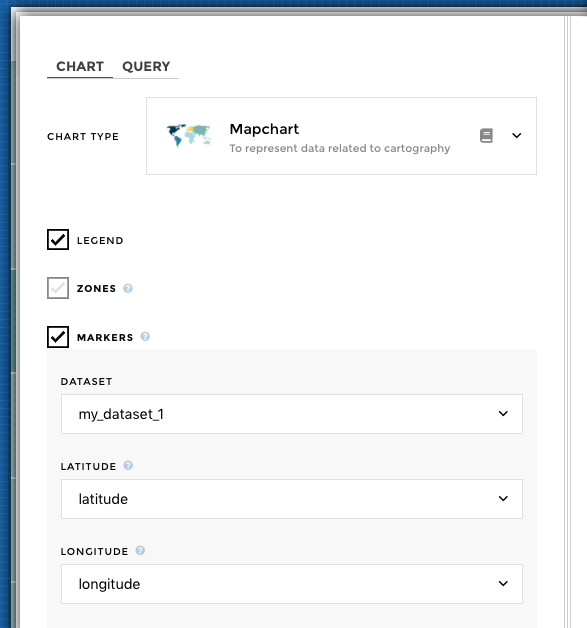
You now need to define the markers from your dataset.
Select the markers’ configuration in the Chart menu.
Position your markers by filling the longitude and latitude
fields with columns containing your coordinates
Optional parameters
You can also fillup optional parameters :
- Add a
labelto your marker to let users know what this maker is. - Add
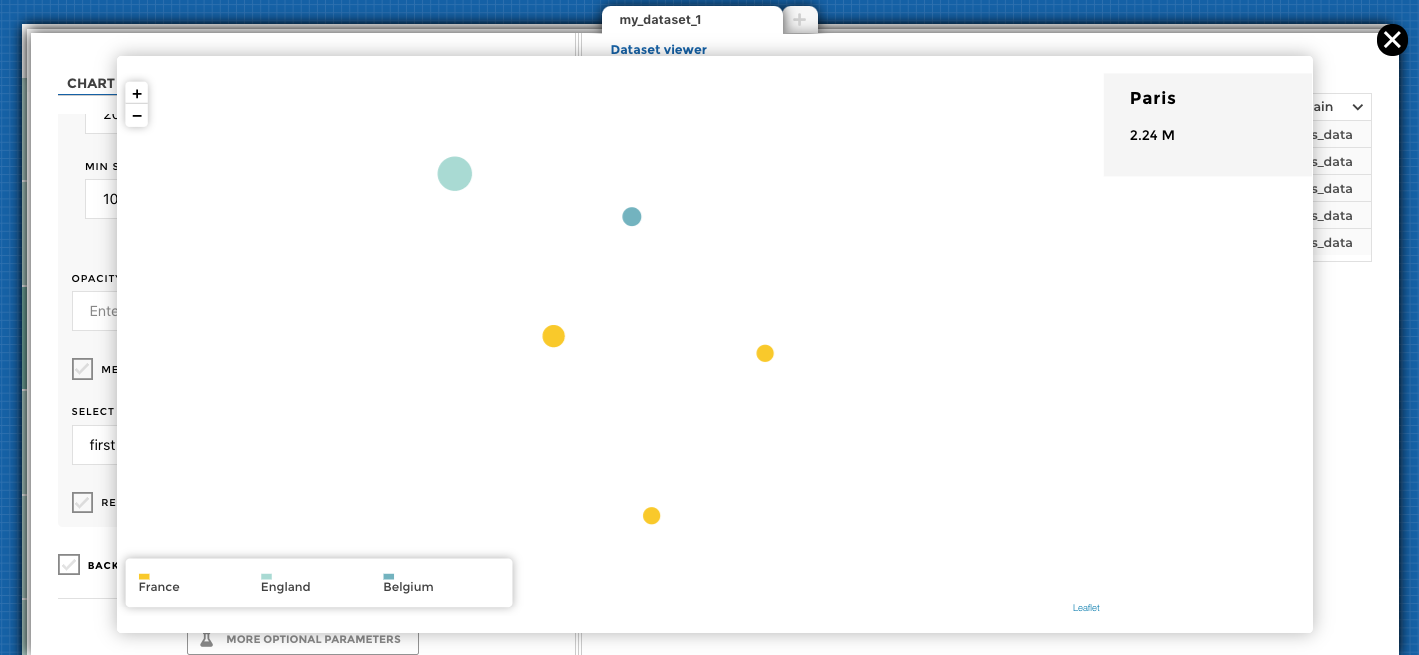
marker's colorto color your pin. For example identify cities from the same country or of different types. Color is useful for visually grouping markers that correspond to a common type. - Adjust
marker's sizeto modify the size of the pin. You can base it from a column or define a fixed size.
Using sentiment
We saw previously that we could configure markers color to color
pins depending on a column. But sometimes, you don’t want to display one
color for each different value, but rather display a sentiment depending
on the value.
To achieve this, simply add a sentiment rule to the column used to color the markers and voilà!
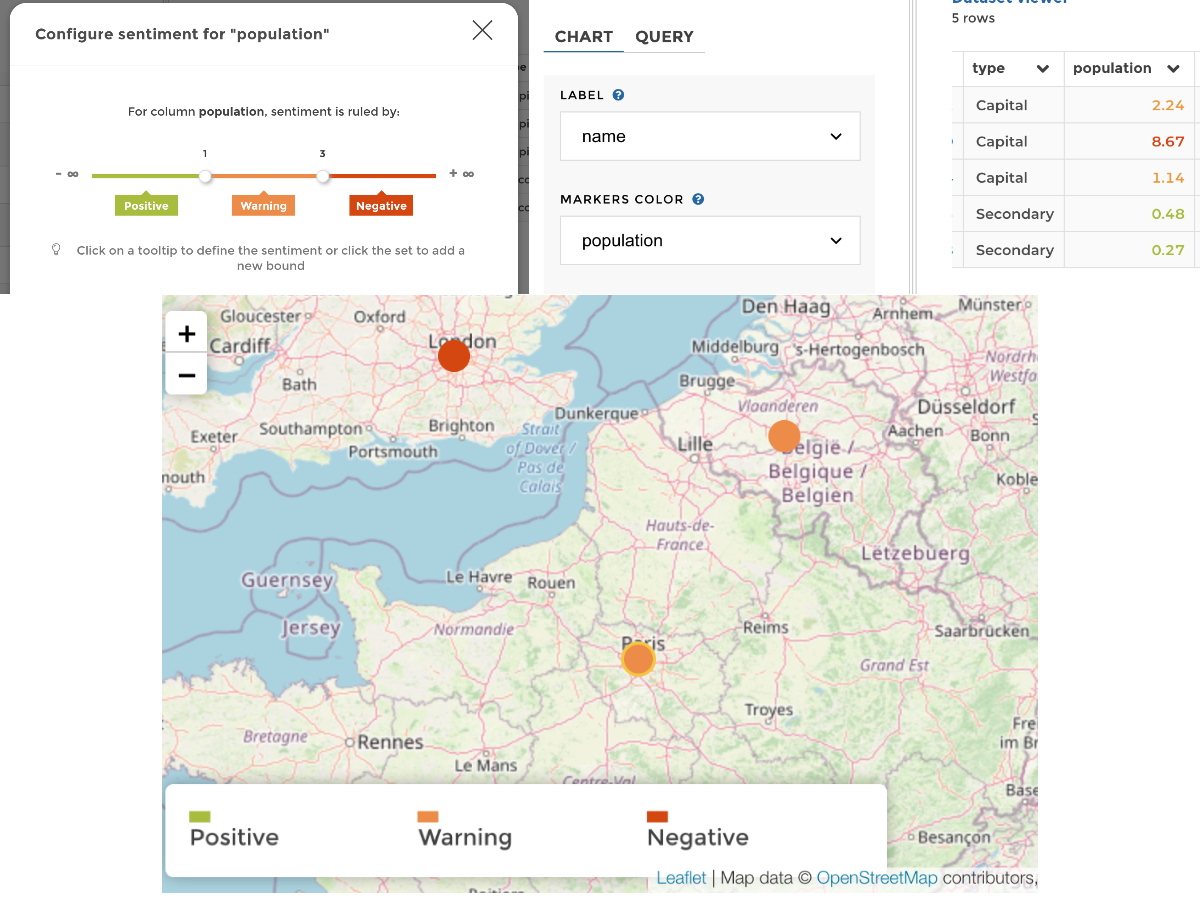
Mapchart with markers colored by sentiment
If you need to customize the label names for each sentiment, that’s is
possible as well! You need to switch to code mode and add a labels
property: 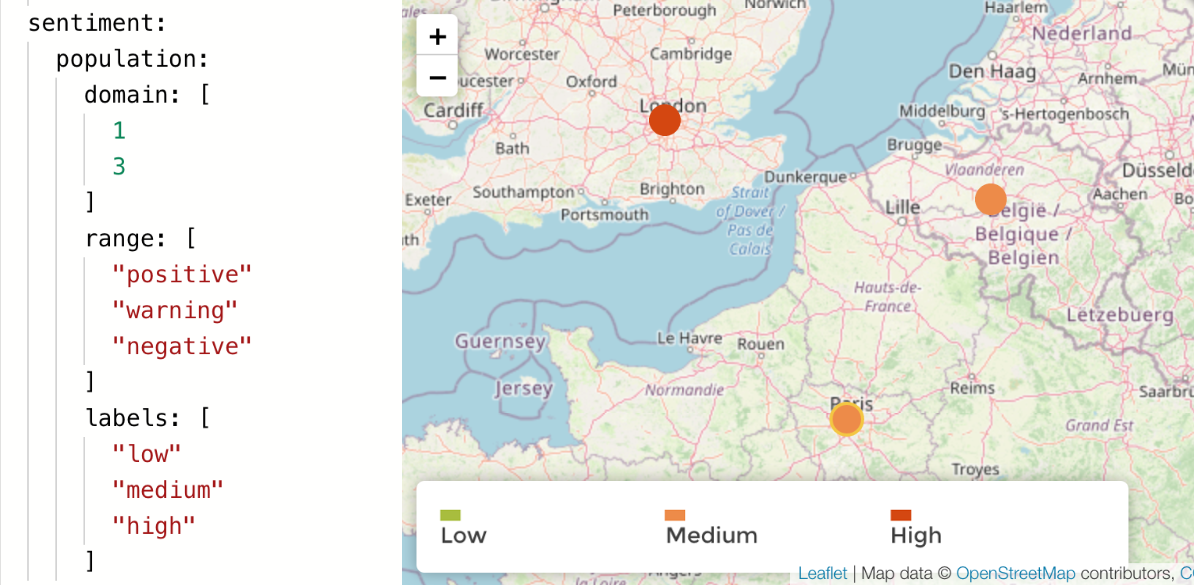
Background
Right now all you have is a bunch of points on a white background.
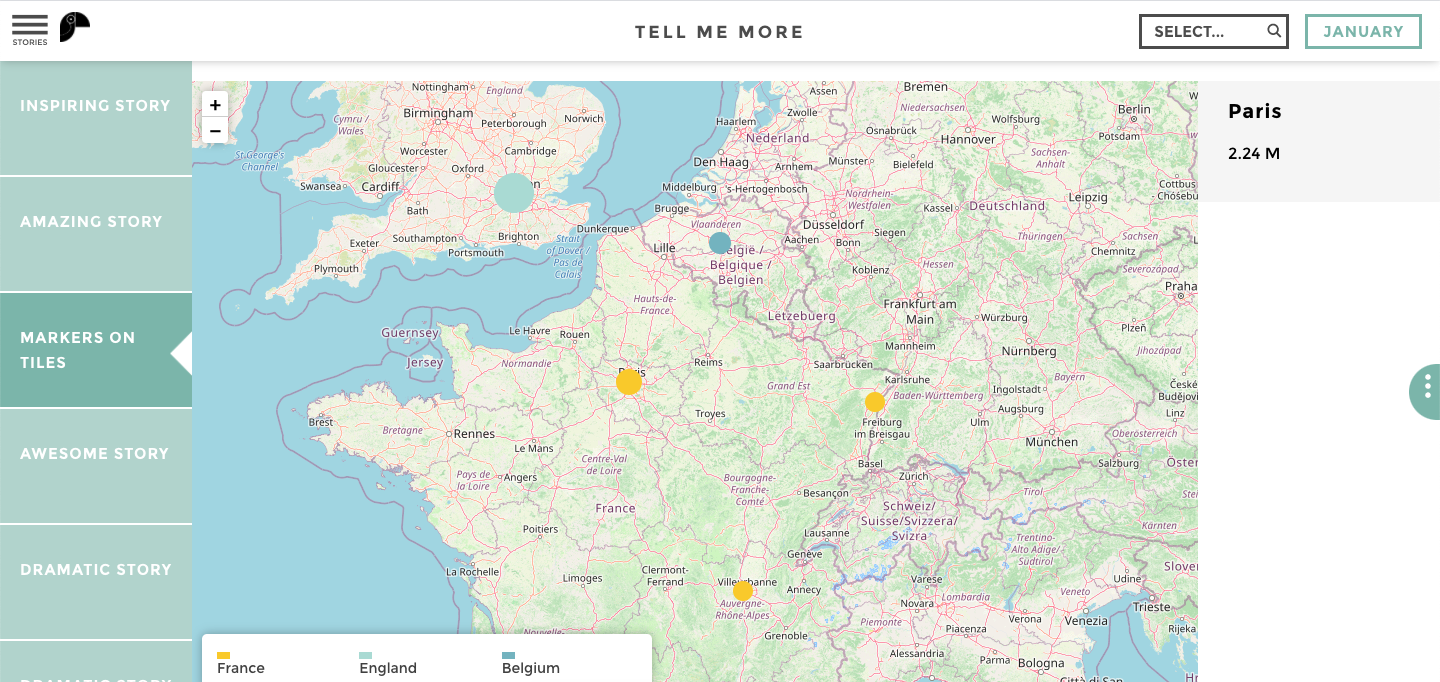
You need to add tiles to draw the shape of your map. “Tiles” are the squared images that, when put together, constitute a map. They can contain administrative boundaries and labels, roads, terrain, and even building names.
All tiles together form the background of your map behind your markers.
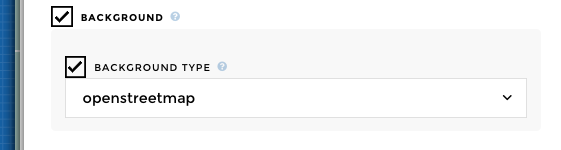
Activate the background and select the default background type.
Warning
Don’t hesitate to save your story and refresh your page to see changes.
And you are done !! 🎉 🎉
OMG sooooo easy 😱 😱 😱