Funnel Tutorials
Step by step tutorial
The user story
I’m an Online Company Director which sell pet food. 🐶
I need to follow the buying process step by step.
Which step weighs the most heavily in the purchasing process? Where is the lowest conversion rate ? At which step we lose clients ?
If I need to observe the correct course of the buying process, let’s do a funnel!
Warning
Before you start!
Make sure you added your datasource to your application. Once you’re done create a new story.
The dataset
Here is an example of the dataset expected to create a nice funnel:
| STEP | VALUE | VARIATION |
|---|---|---|
| Basket | 12.0 | +5.1 |
| Shipping | 8.0 | +6.4 |
| Payment | 5.0 | -1.4 |
| Transactions | 3.0 | -1.0 |
| Buy | 2.0 | +2.0 |
Very simple, isn’t it ? 😉 There is one line per step, and for each one of them there is the % of value corresponding to the step, and eventually an evolution before a previous period.
Note
The chart automatically calculates the conversion rate between each step 🤩🤩🤩
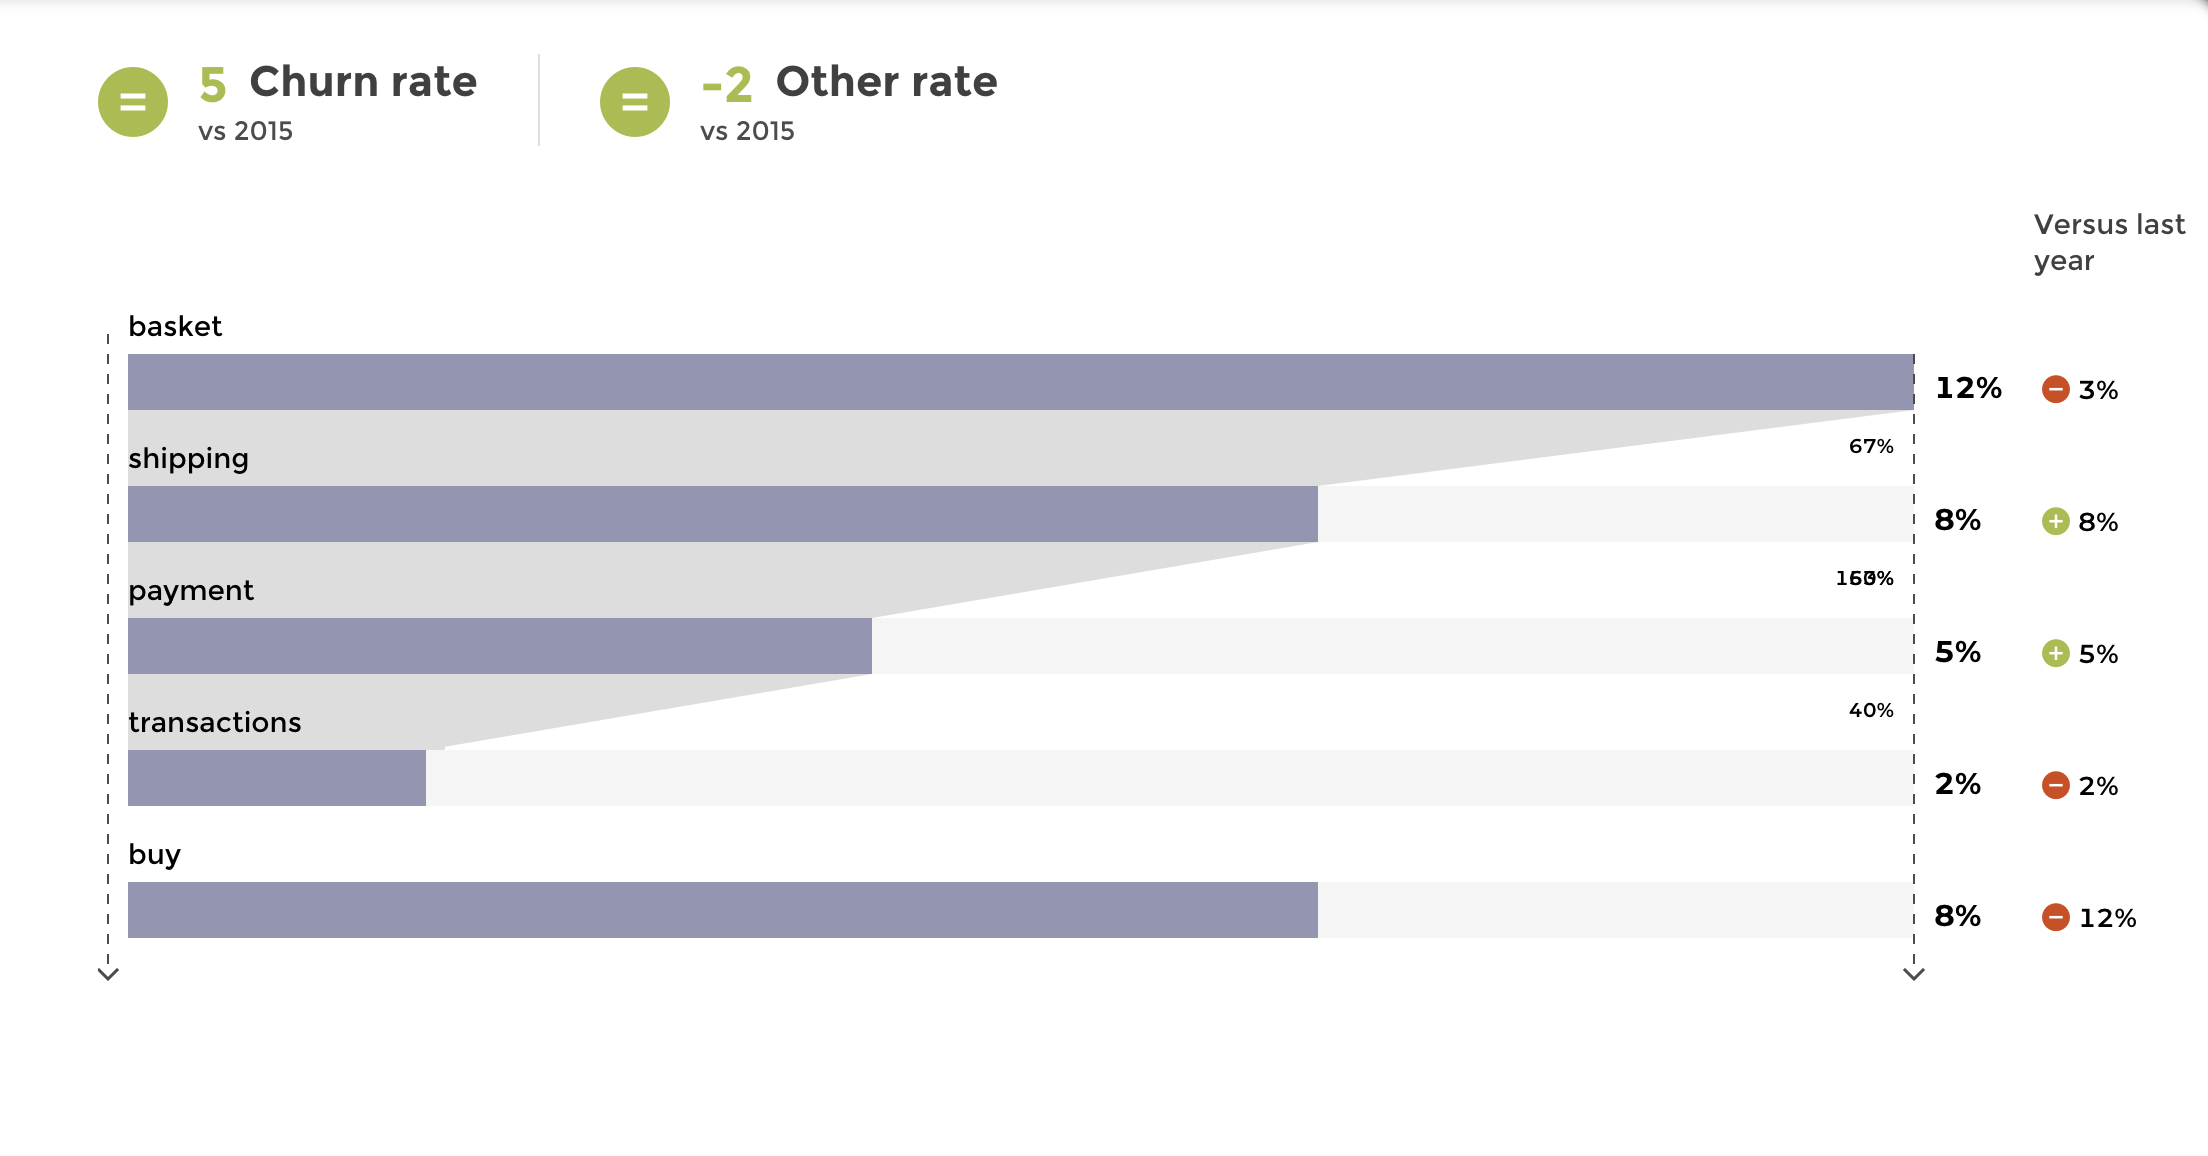
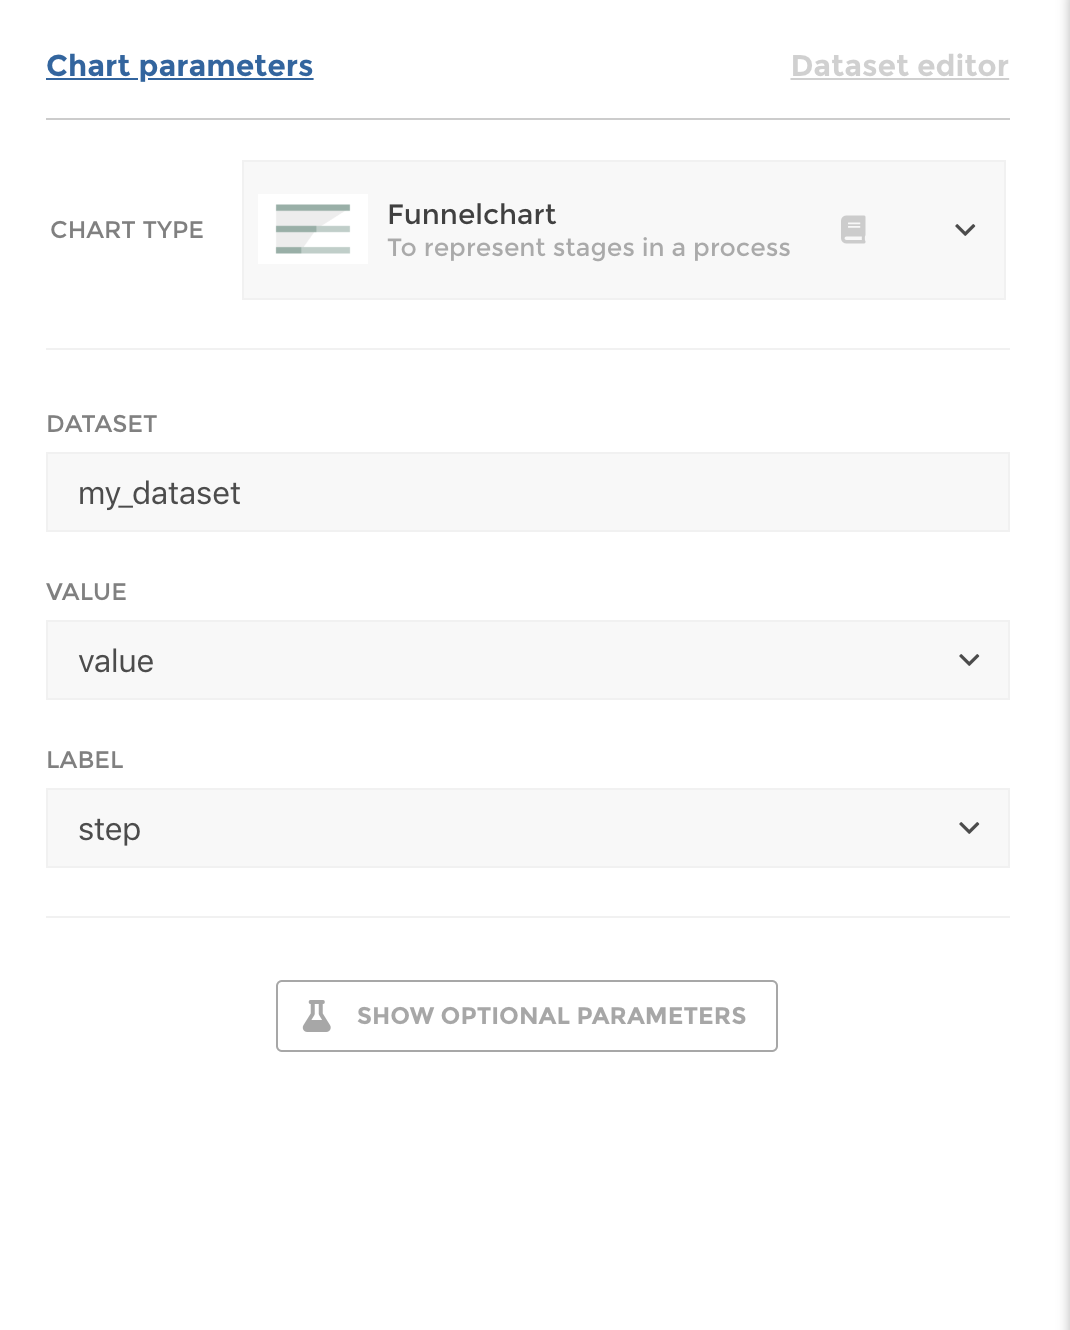
Chart Parameters
Once my data has been setup, I just need to follow the steps and in 2 clicks I’m done! ✅
I need at least :
- a
labelcolumn - that will be displayed as the different steps of the process - a
valuecolumn - that will be displayed as the share corresponding to each step - and sometimes an
variationcolumn - that will be displayed next to thevalue