How to :: multiple charts in one story
Double charts
When creating a story it is possible to insert two charts into the same story. From an existing story, go to the Edit menu and Add a chart.
Then create your second chart!
The charts you’ll be creating are not “connected” to each other, they will be displaying separate information with no common interaction, except filters if so desired.
Crossfilter charts (ex master-slave)
When creating a story, you can insert two charts into the same story that are dependent on one another.
The upper chart will affect the second chart, acting like a filter. We call it a “crossfilter chart”.
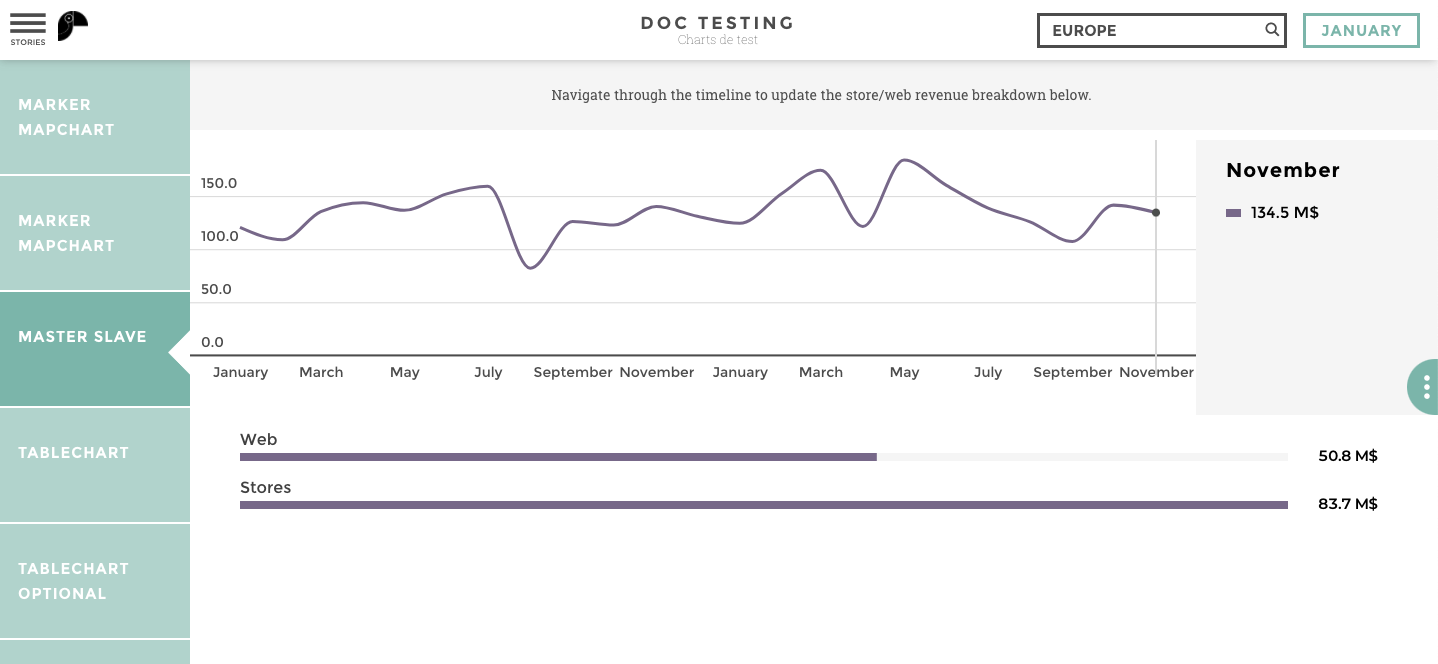
📝 As I navigate through the months on the line chart in the example below, the bar chart beneath will update its value based on the selected month.
Step 1: Create a double chart story
Start by creating your 2 charts without thinking about connecting them yet.
📝 For example, I want to see the evolution of my revenue among the months, but I’d also have the breakdown for stores and web.
So I need to create 2 charts:
- a line chart with the total revenue per month
- a leaderboard with the revenue for stores and online
Step 2: Crossfilter
Once my charts are created, I need to define what is “linking” them.
- You will only need to set up the link option on your primary chart to cross filter your second chart
- You have now defined that the line chart is the primary chart and the leaderboard is the filtered chart
- The primary chart will crossfilter the filtered chart and your whole story will be customized to your users needs
- The date is what the filtered chart will be filtered on
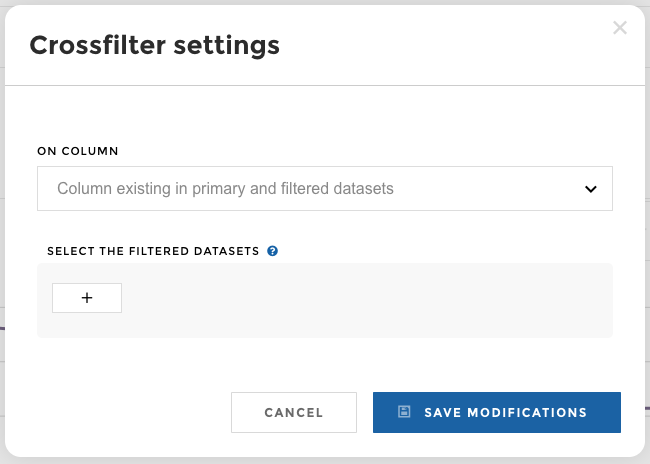
Hover on your first chart, the primary. Click on the link button to create the crossfilter.
on: the name of the column on which the filter will be applied. It should be in both charts dataset. 📝 In our example above, the crossfilter would be on a column containing the date.datasets: the name of the filtered chart dataset. 📝 In our example above, I would use the name of the barchart dataset, usuallymy_dataset_1.
You can find the names of your available datasets in the tabs in the edit menu
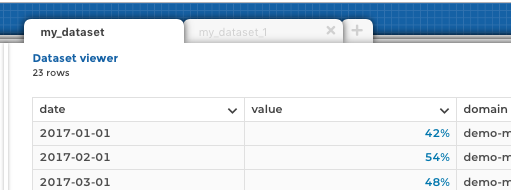
dataset names
Available charts for primary charts
Note
All charts can be used as filtered charts but only those listed below can be used as primary charts.
The following charts can be used as primary:
barandlinechart,linechart: The current selected date is used as a filter, see below for more info on the dates crossfilter.barchart: The value used for filtering will be the value of thelabelselected on the barchartcircularchartt: The value used for filtering will be the value of thelabelselected on the circularchartstackedbarchart: The value used for filtering will be the value of thelabelselected on the stackedbarchartmapchart: The value used for filtering will be the value of thelabel(zone or marker) selected on the mapchartheatmap: The value used for filtering will be the concatenation of_in between thexandyconfiguration keys in the selected data object, egX_YIf the selected value has something like the following:x y value France Shoes 1
It will filter the second chart with France_Shoes.
Crossfilter on Dates
Warning
Date formats can be tricky. So here’s some advice.
Make sure to define the same format of your date column in both the primary and filtered datasets.
Crossfilter on HKPI
Note
KPIs can be used with a crossfilter from the master chart. Just make sure you add your hkpi dataset in the crossfilter configuration.
Make sure to define the same format of your date column in both the primary and filtered datasets.
Chart Size
When having 2 charts at the same time, you might want to display one as smaller than the other.
By default, both charts will occupy half of the screen height but you might want to make the top chart smaller.
You can find the size parameters on your chart options (into the
Advanced Optional Parameters category)
You can specify a size for each chart. Make sure size of the two
charts does not exceed 1.
If you need to set a different ratio for mobile displays, use the
mobile size option (if there is no mobile size option, the
size option will also be used for mobile).
Filter on Multiple Charts
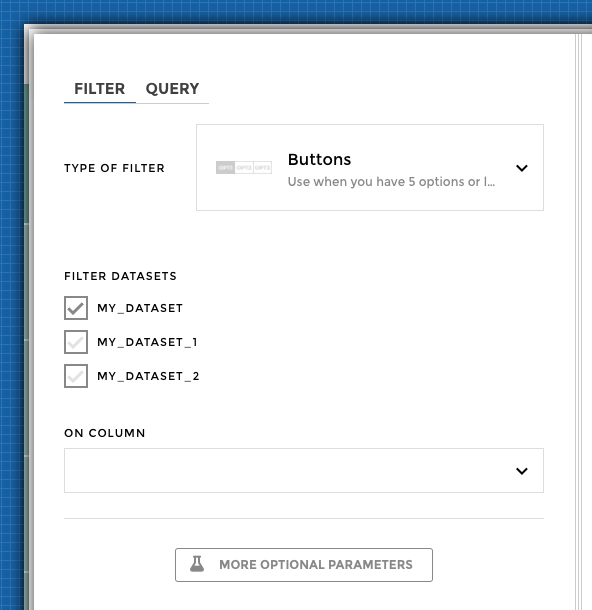
When you have more than one chart in a story, you can decide if the filters will be applied on one or both charts.
For each filter, choose which dataset will be filtered.