Scorecard Tutorials
Step by step tutorial
The user story
I’m a C-level manager in an international company. ✈️
I’d like an overview of KPIs which are not directly related to each other.
📝 For example, I’d like an overview of the number of facebook likes for each country and of the budget evolution.
Since I need to display indicators that have no direct correlation amongst each other and that have different units, let’s do a scorecard!
Warning
Before you start!
Make sure you added your datasource to your application. Once you’re done create a new story.
The dataset
Here is an example of the dataset expected to create a nice scorecard:
| budget | cast_total_facebook_likes | country | genre_type | region |
|---|---|---|---|---|
| 1981.0 | Belgium | Action | Europe | |
| 34.0 | 369.0 | Belgium | Comedy | Europe |
| 27.73 | 4946.846153846154 | Canada | Action | North America |
| 13.290 | 3147.682926829268 | Canada | Comedy | North America |
Very simple, isn’t it ? 😉 There is one line per country, per region and per genre, and for each one of them there is the budget evolution and the number of facebook likes.
Note
Don’t forget to add units to your budget and cast_total_facebook_likes columns to contextualize the information and give meaning to your story!
Chart Parameters
Once my data has been setup, I just need to follow the steps and in 3 clicks I’m done! ✅
I need at least :
a
labelcolumnIn our case my countries
a
valuecolumnIn our case my total of facebook likes
and sometimes a
variationcolumnIn our case my budget evolution
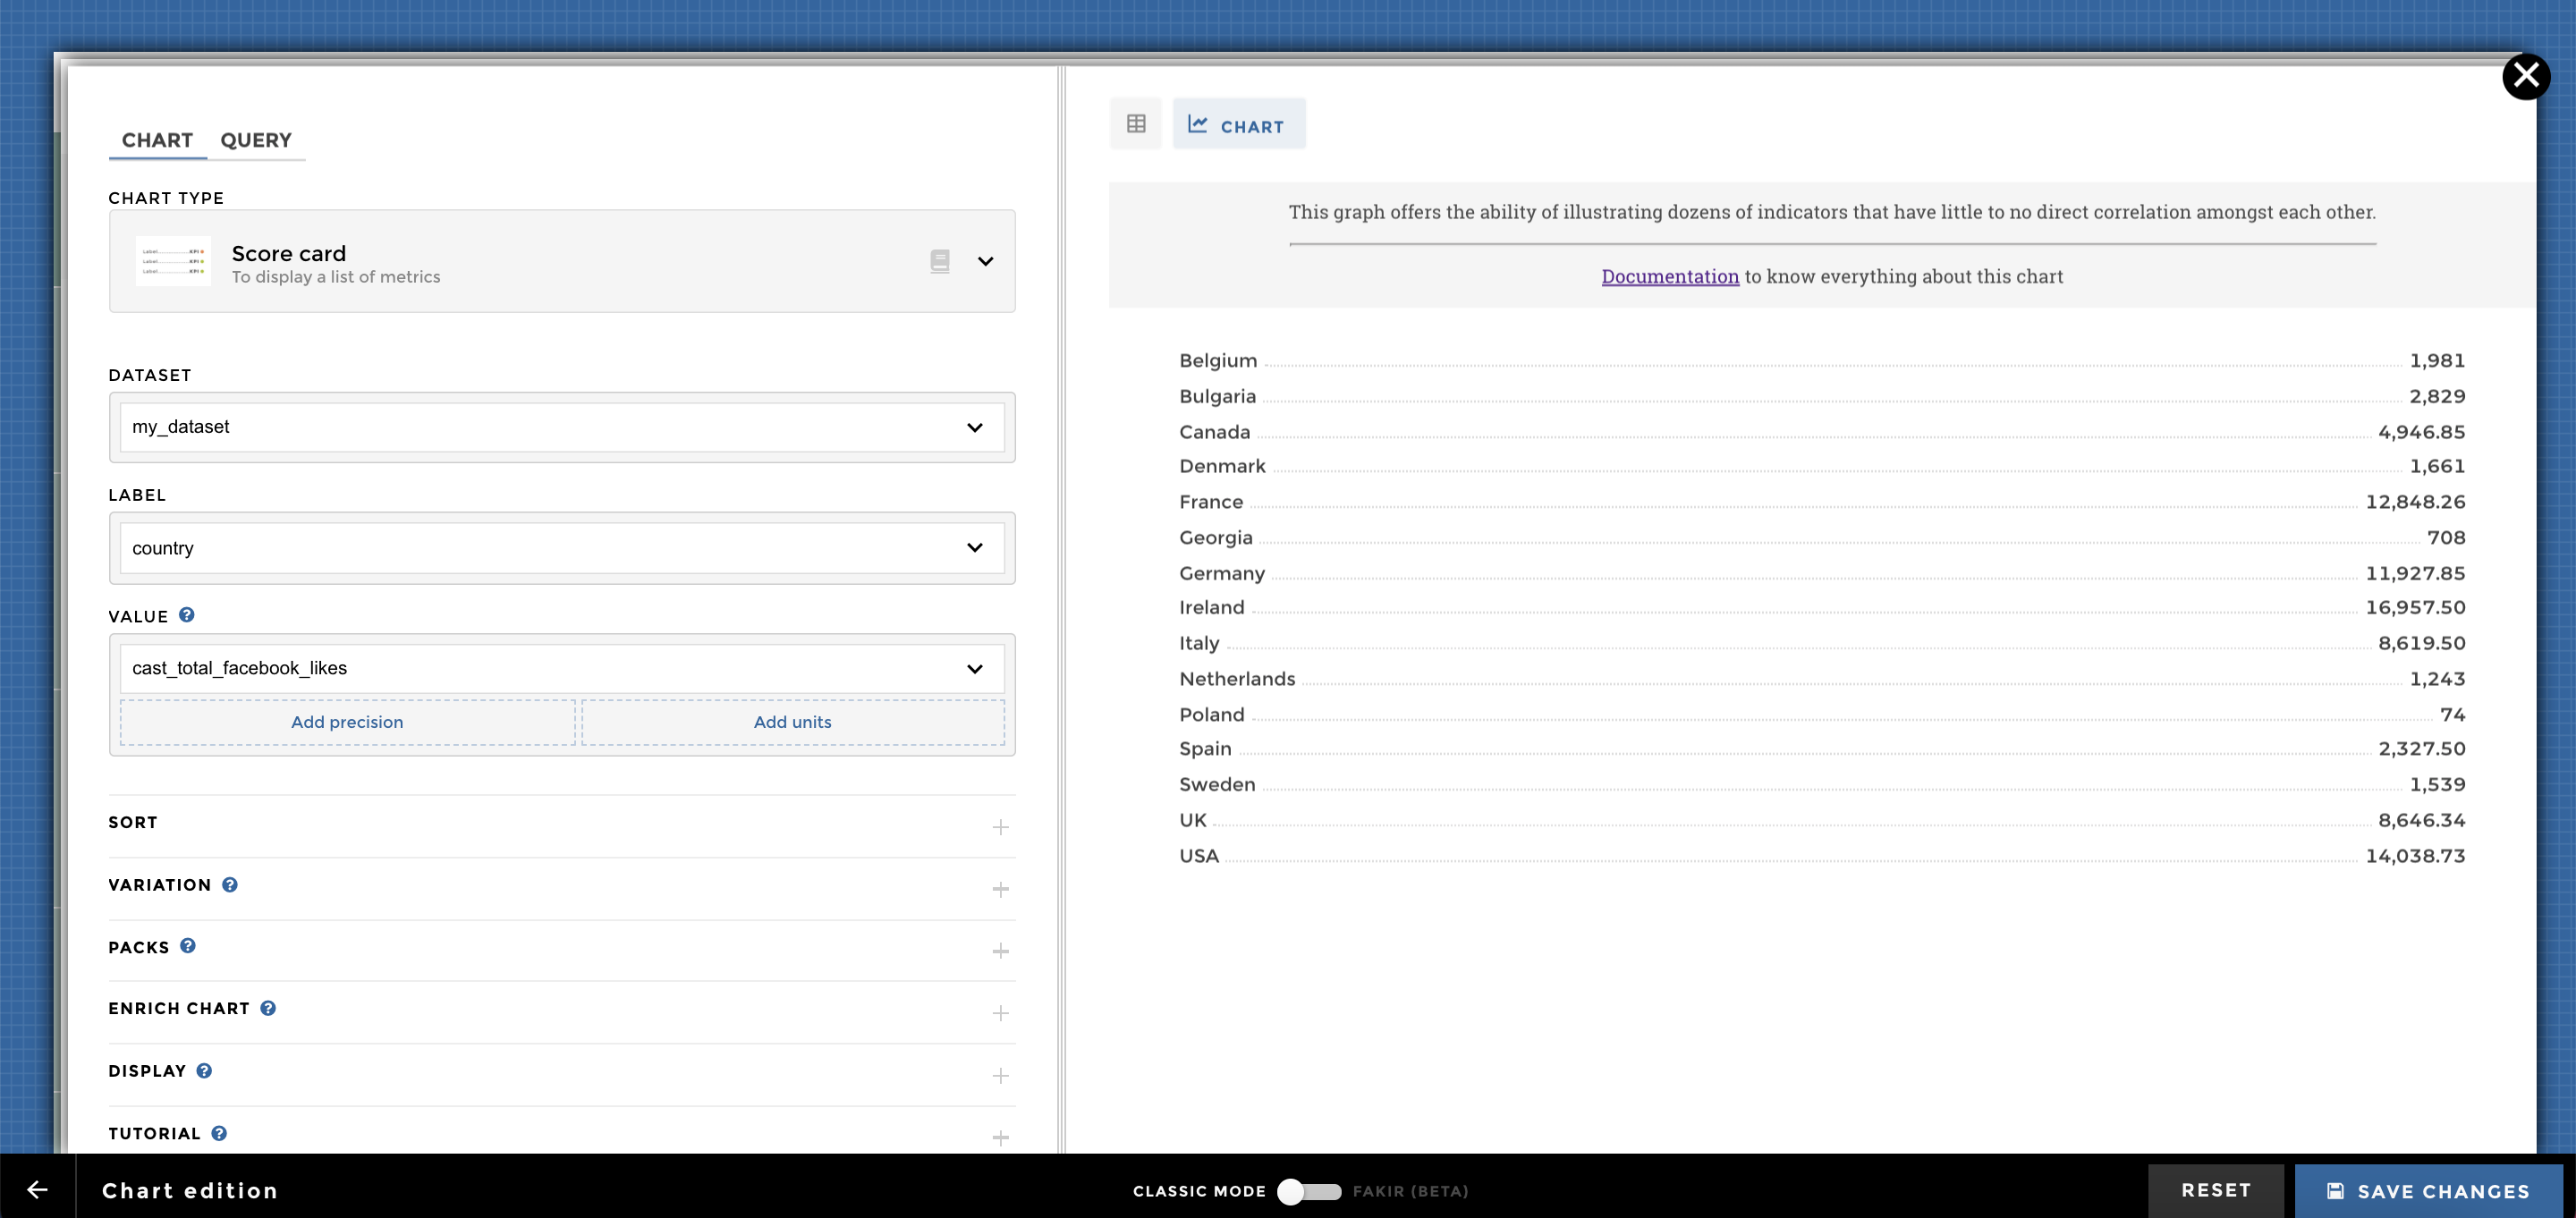
Image of chart Scorecard_Tutorial
Tip
💡 Did you know? Your value can be a number or some text. In our example, it could have been the genre type column instead of the cast_total_facebook_likes one.
Here we go! 🎉
Other configuration examples
Warning
These examples are from the code mode. ⚠️ the chartOptions &
data are deprecated, make sure to use de datasets/charts
configuration.
Data Structure
Dataset used for most of the examples bellow :
| budget | cast_total_facebook_likes | country | genre_type | region |
|---|---|---|---|---|
| 1981.0 | Belgium | Action | Europe | |
| 34.0 | 369.0 | Belgium | Comedy | Europe |
| 27.73 | 4946.846153846154 | Canada | Action | North America |
| 13.290 | 3147.682926829268 | Canada | Comedy | North America |
Ex1: With Units
To add some units on your story, you can take a look to this documentation:
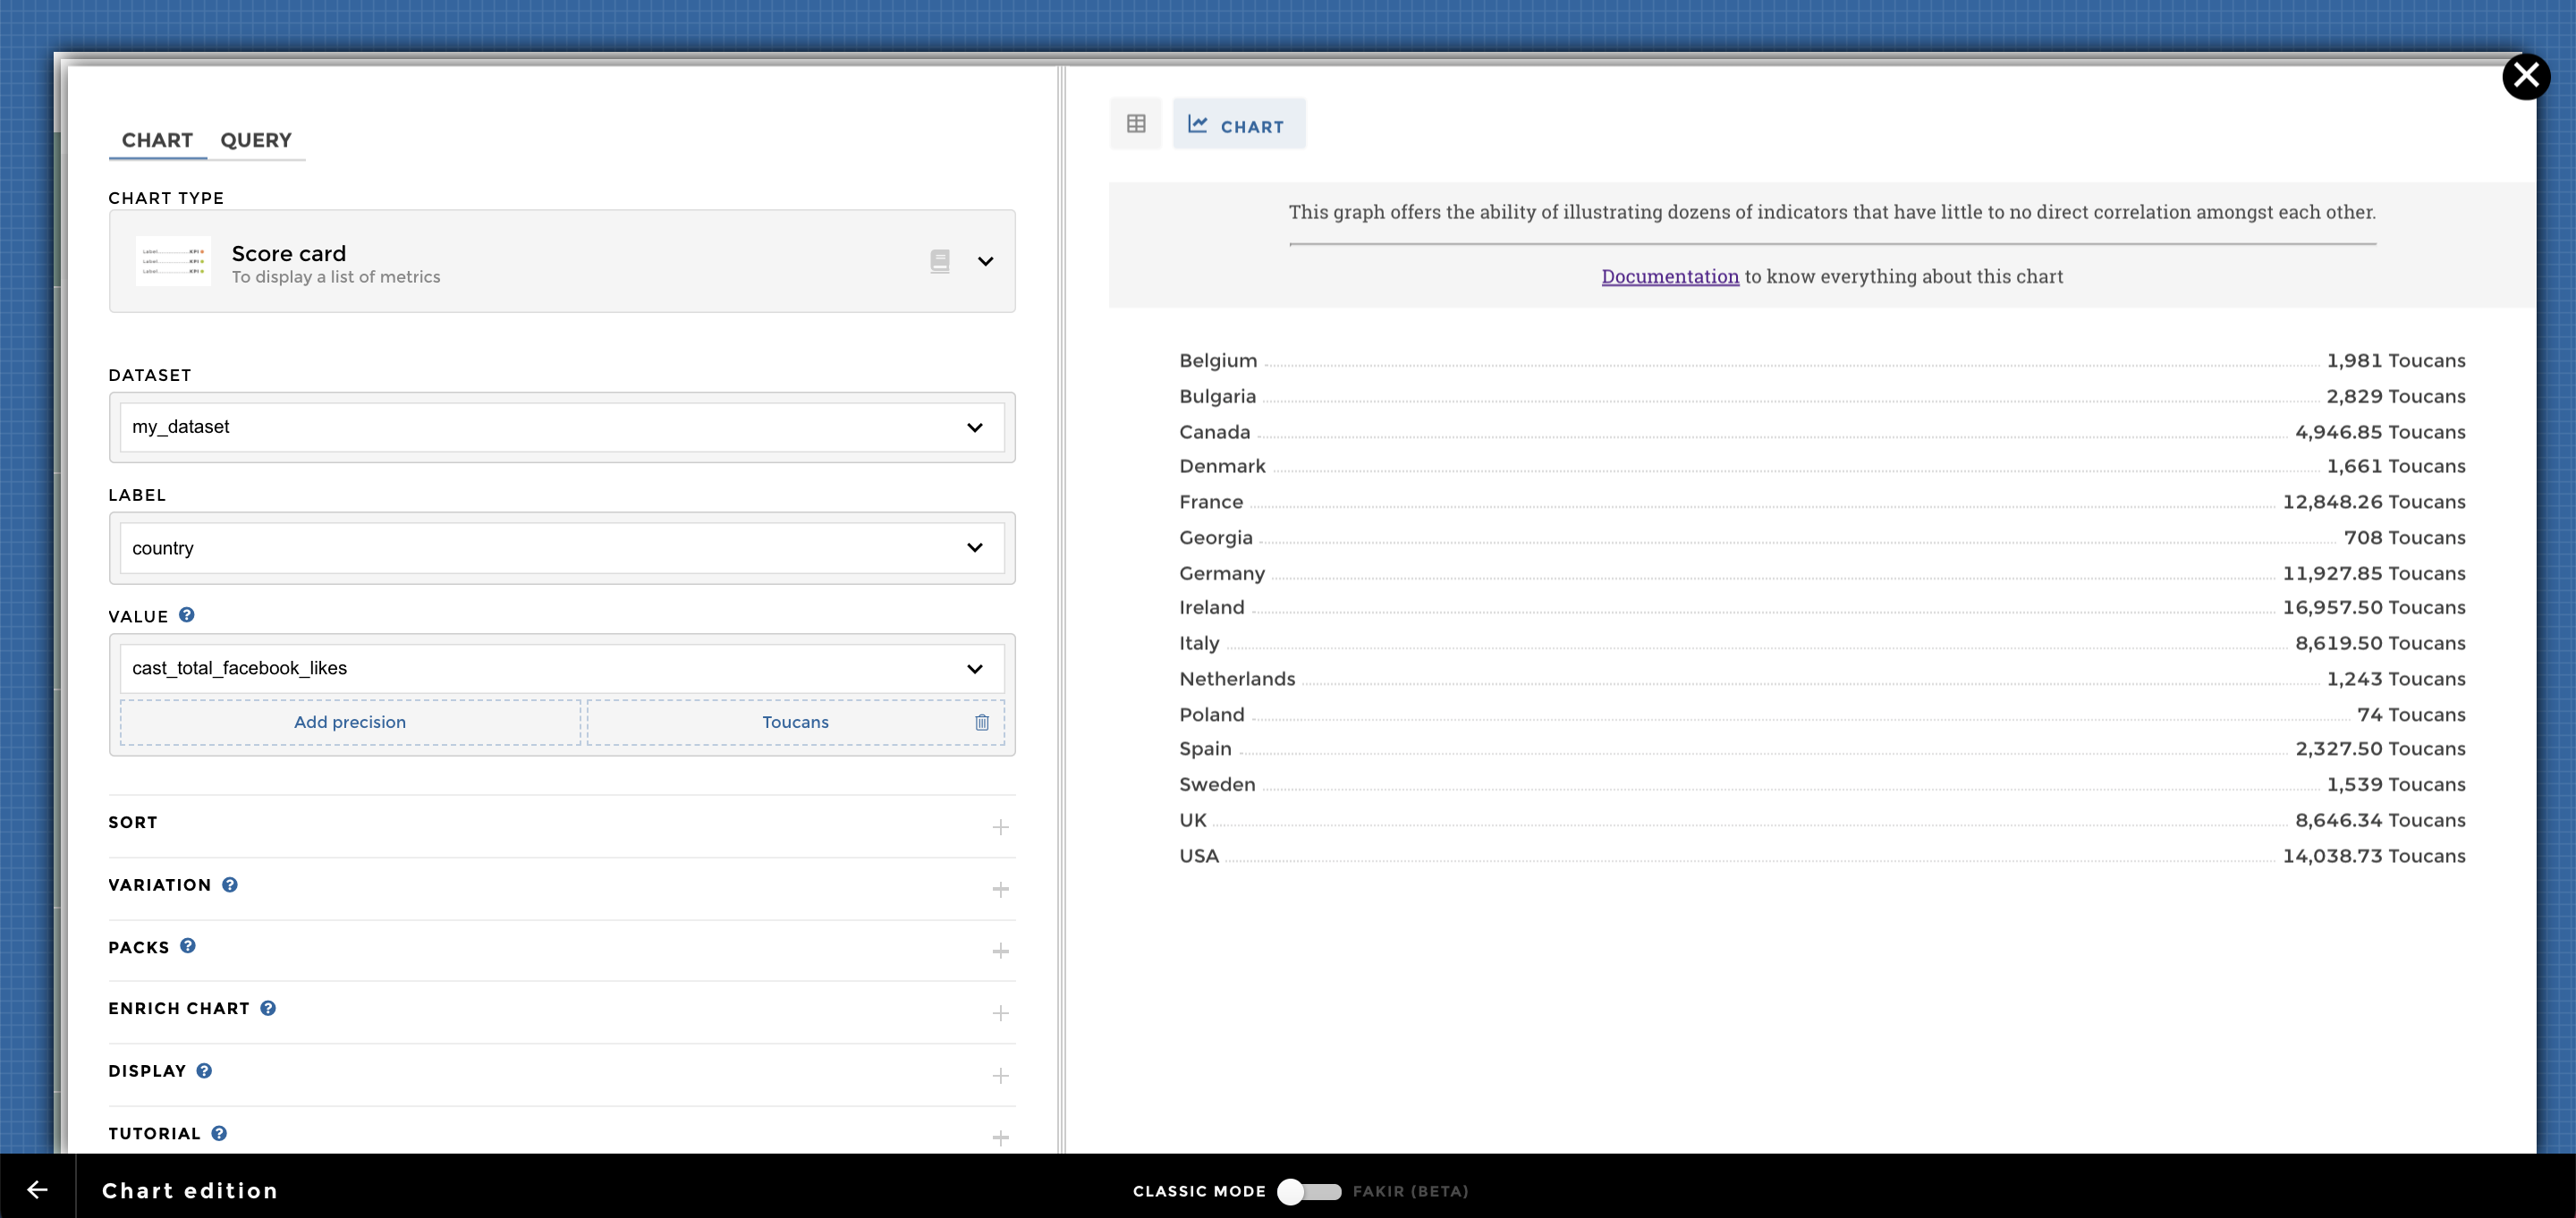
Image of chart scorecard_units
Ex2: With Variation
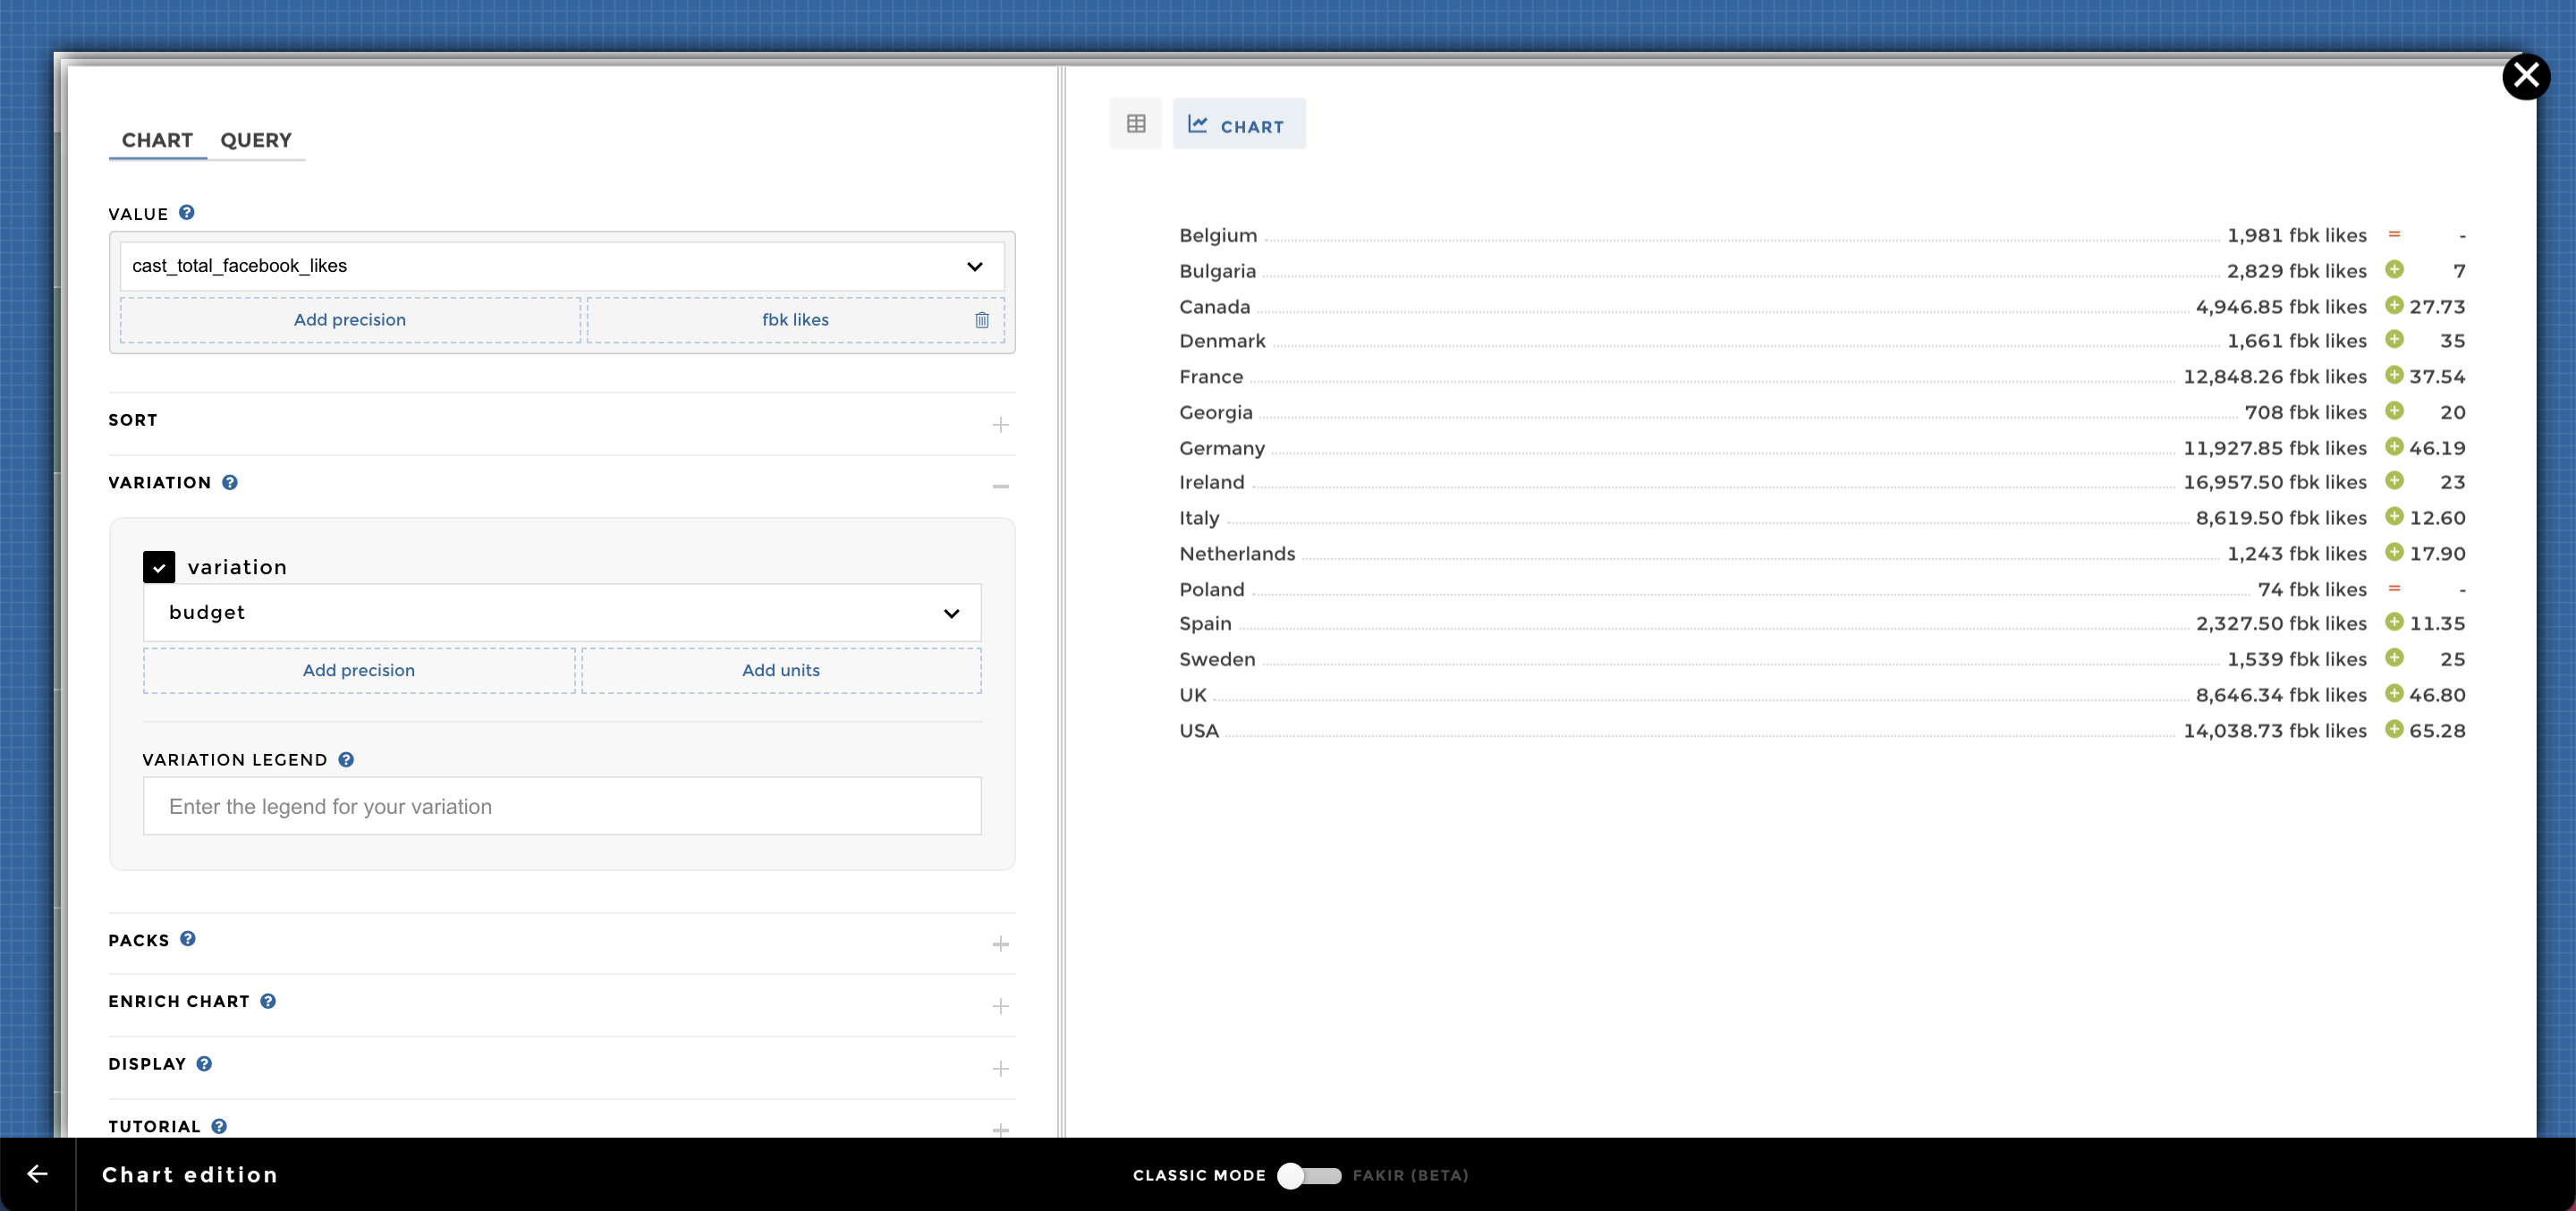
Image of chart scorecard_var
Ex3: With variationLegend and precision
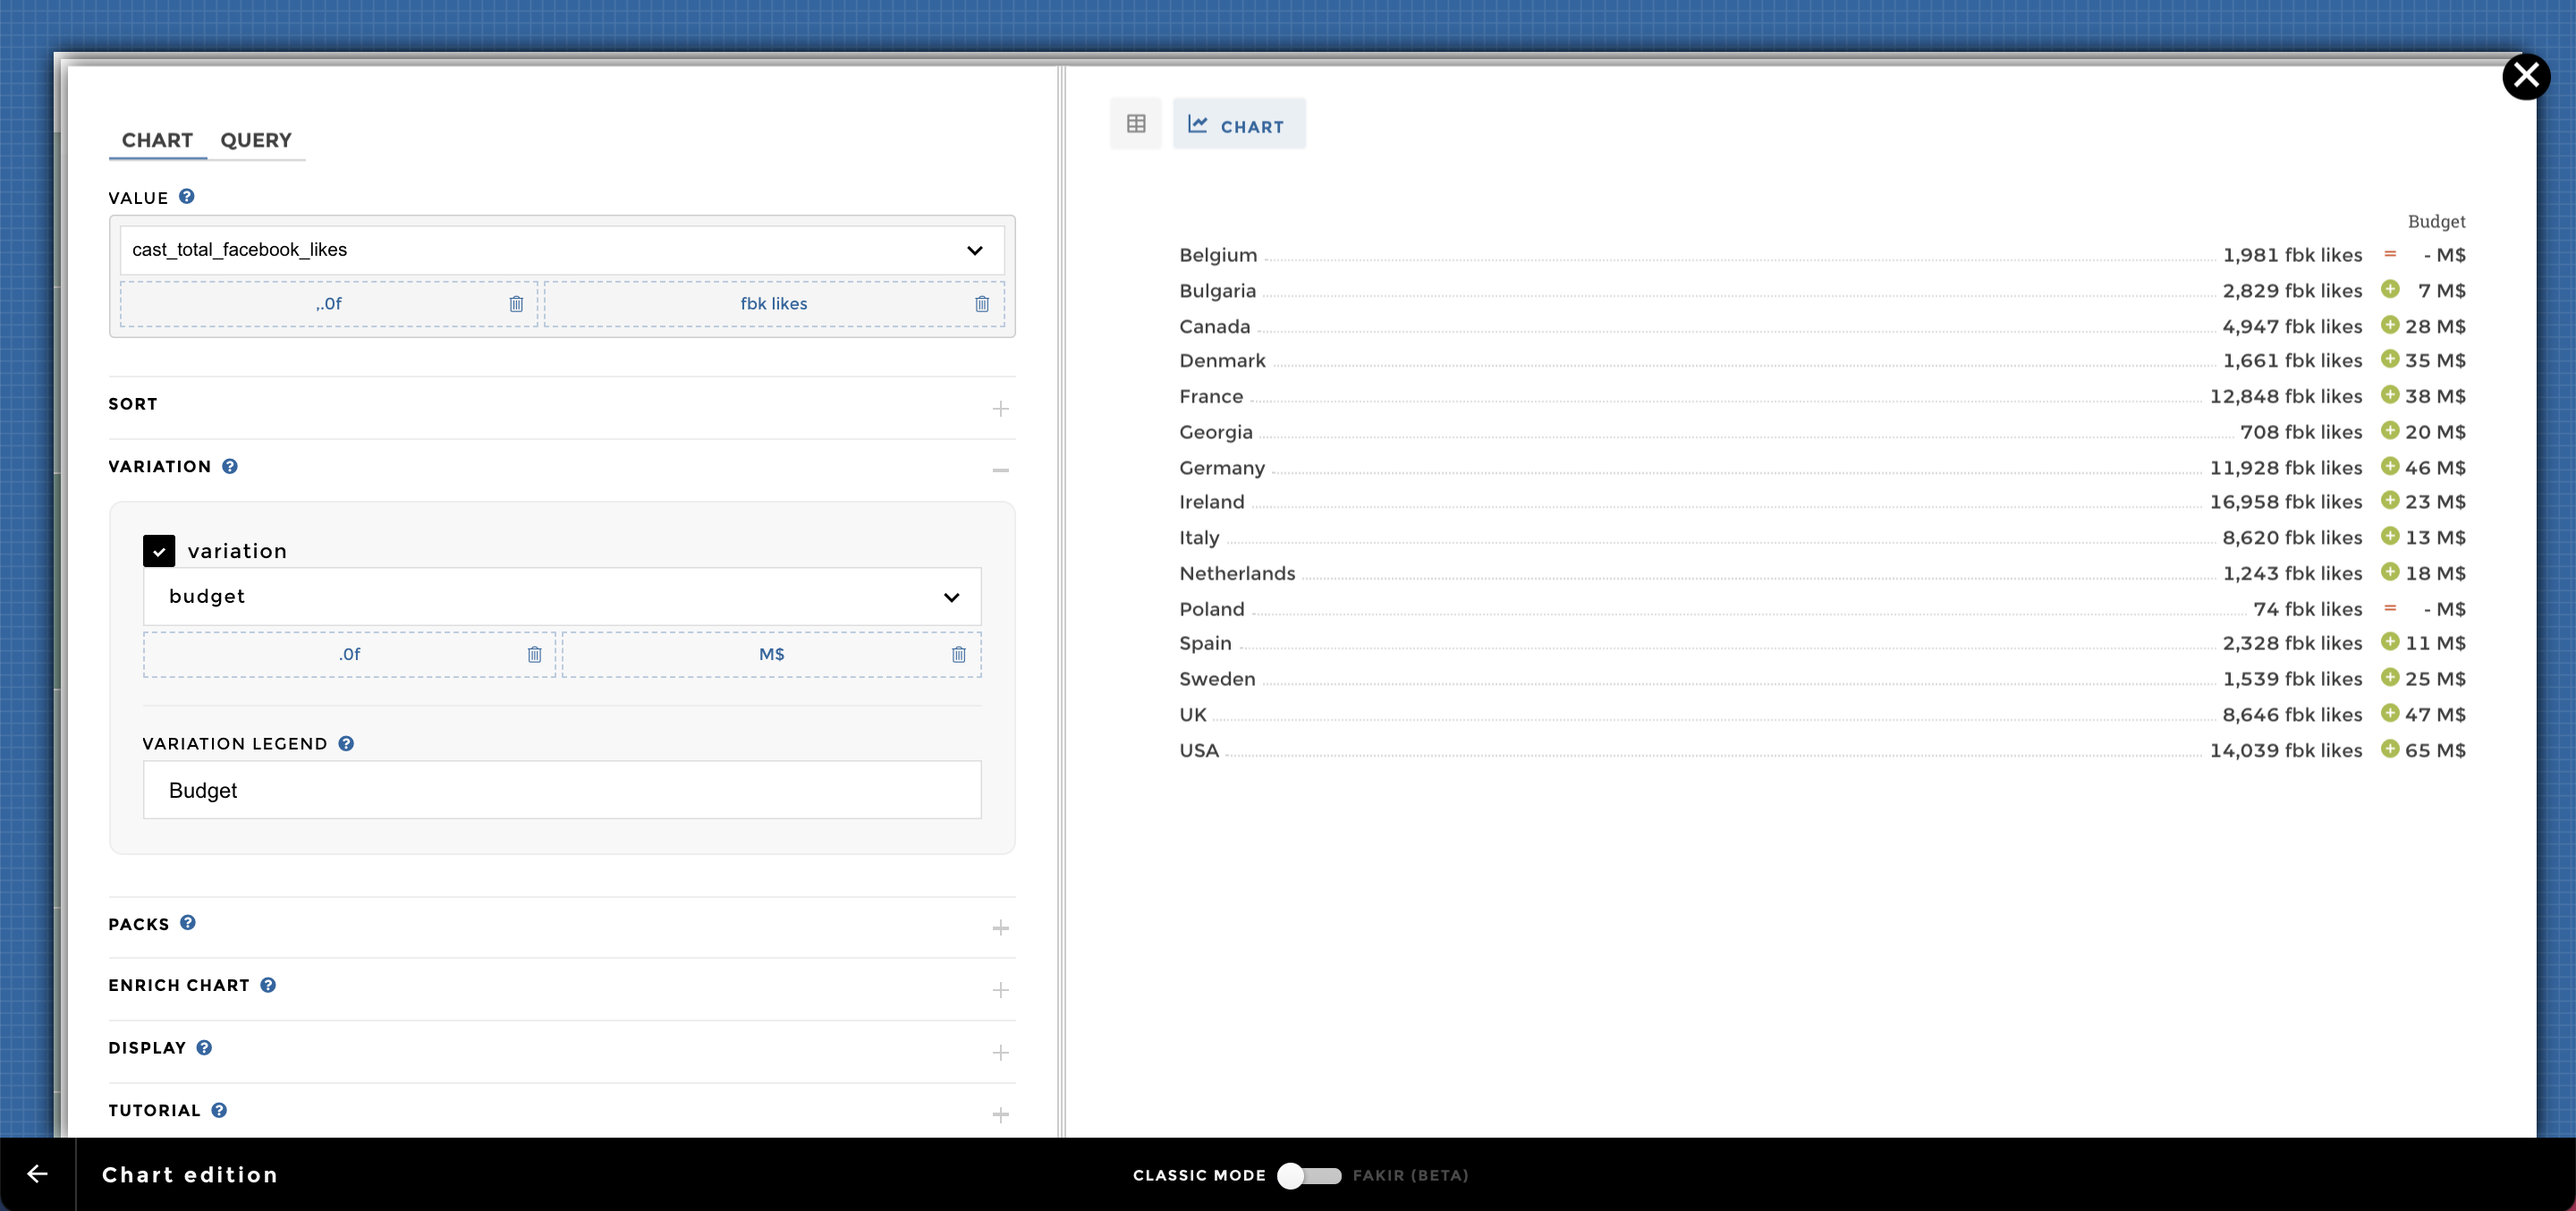
Image of chart scorecard_varlegend
Ex4: With packs and packsNames
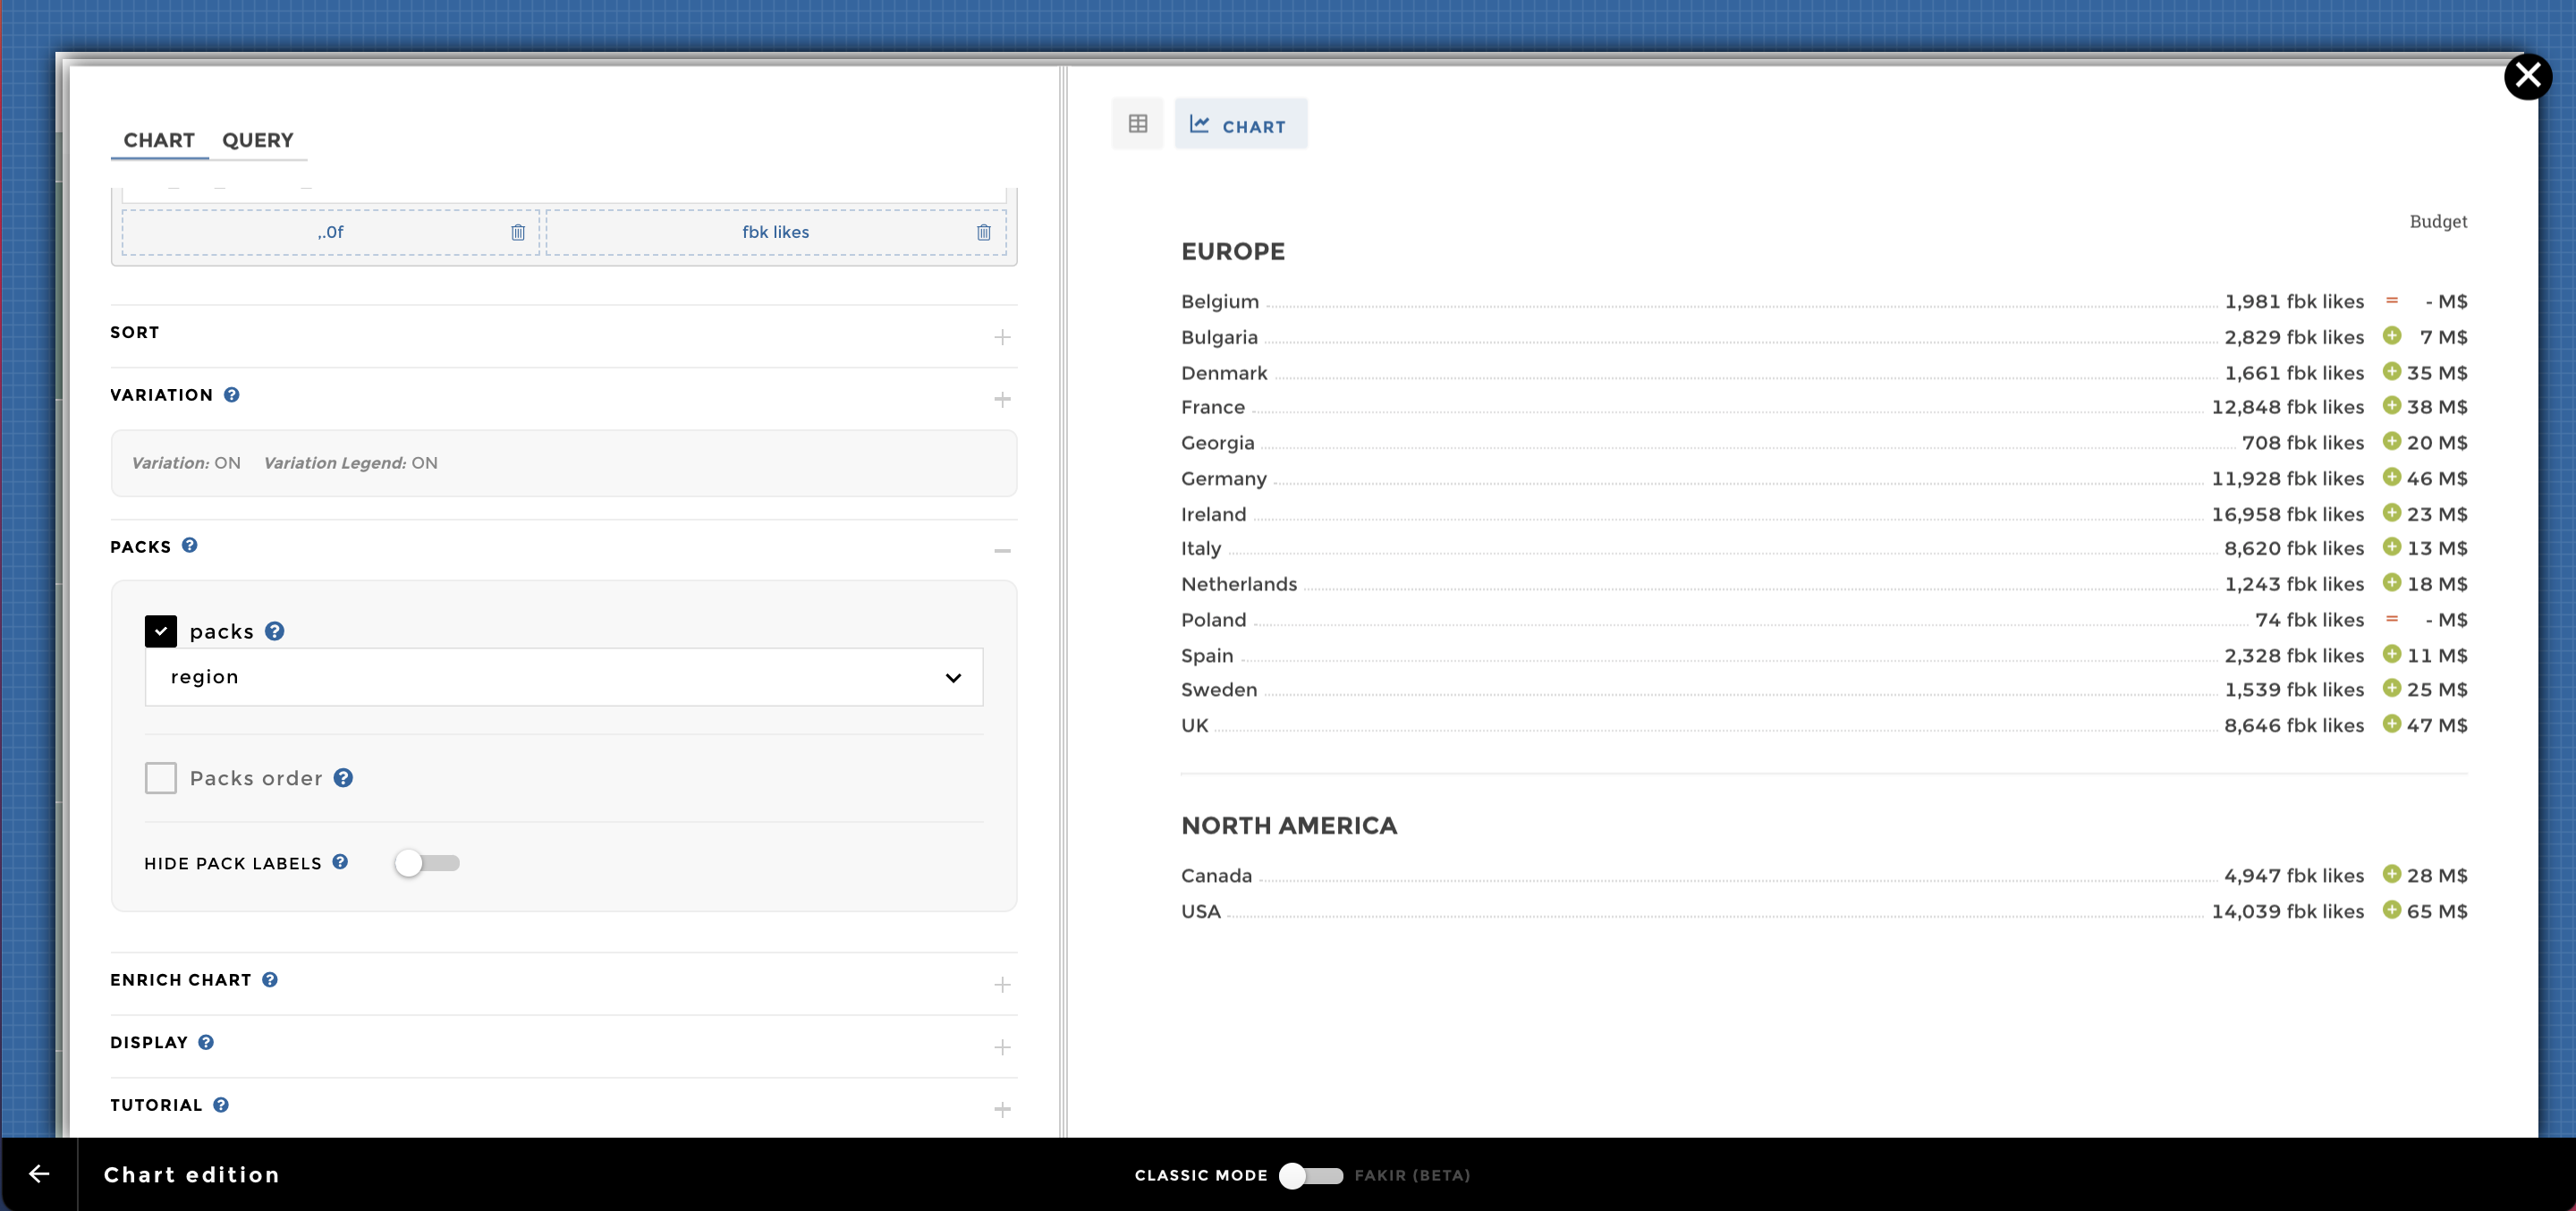
Image of chart scorecard_packs
Ex5: With custom packsOrder
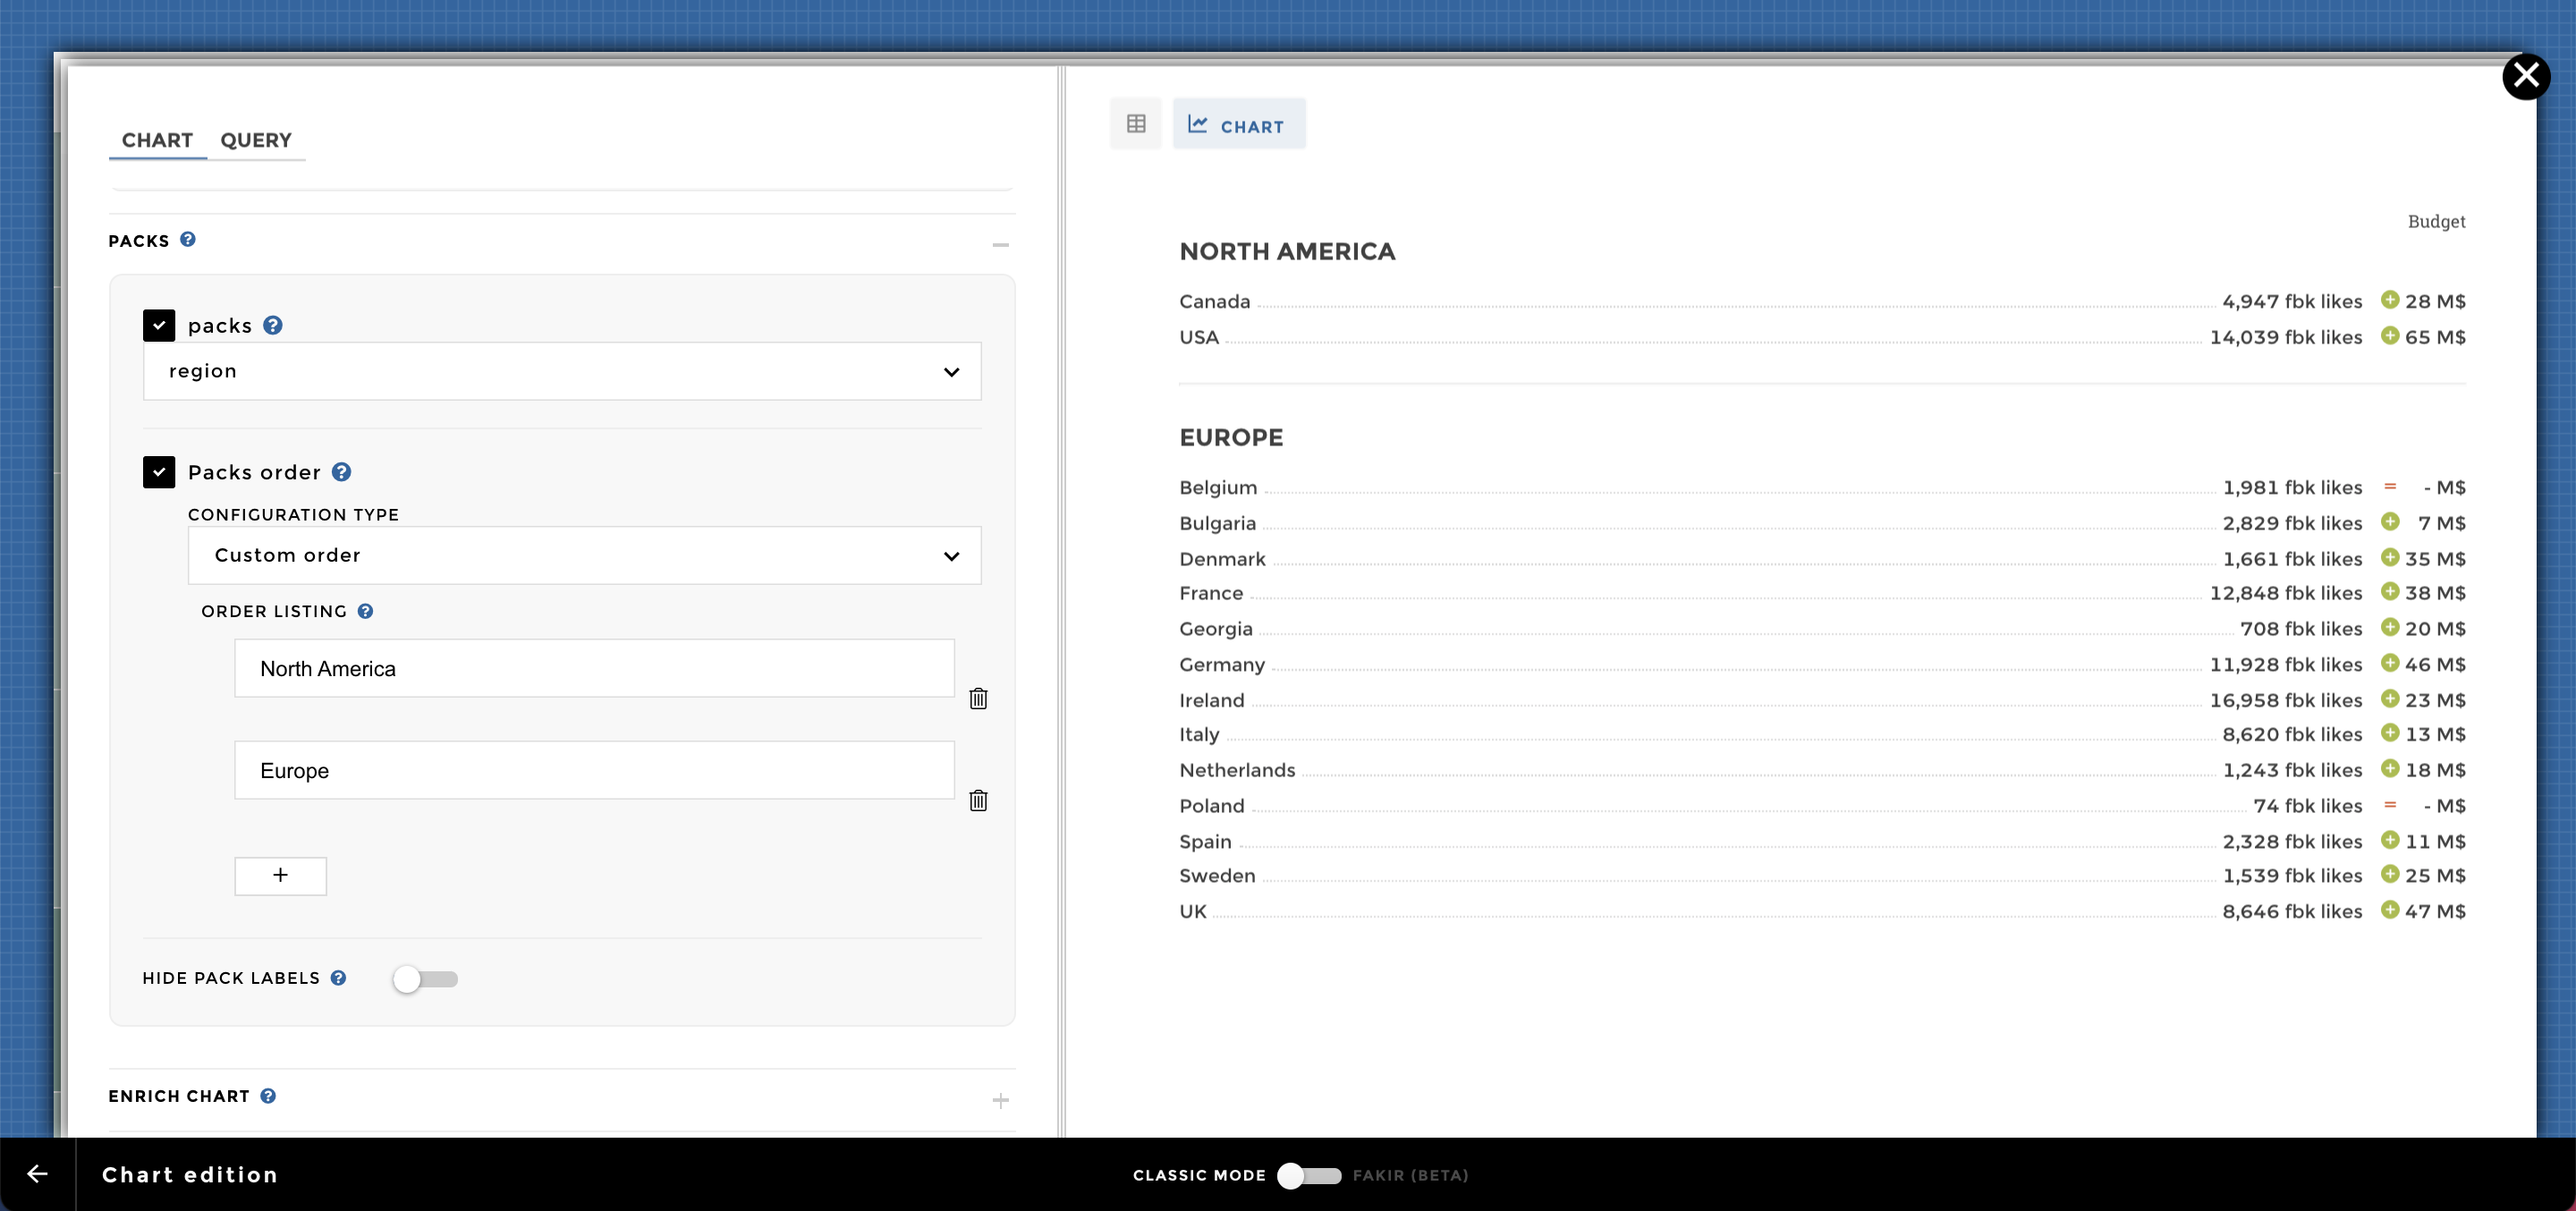
Image of chart scorecard_packsorder
Ex6: With packs order by a column
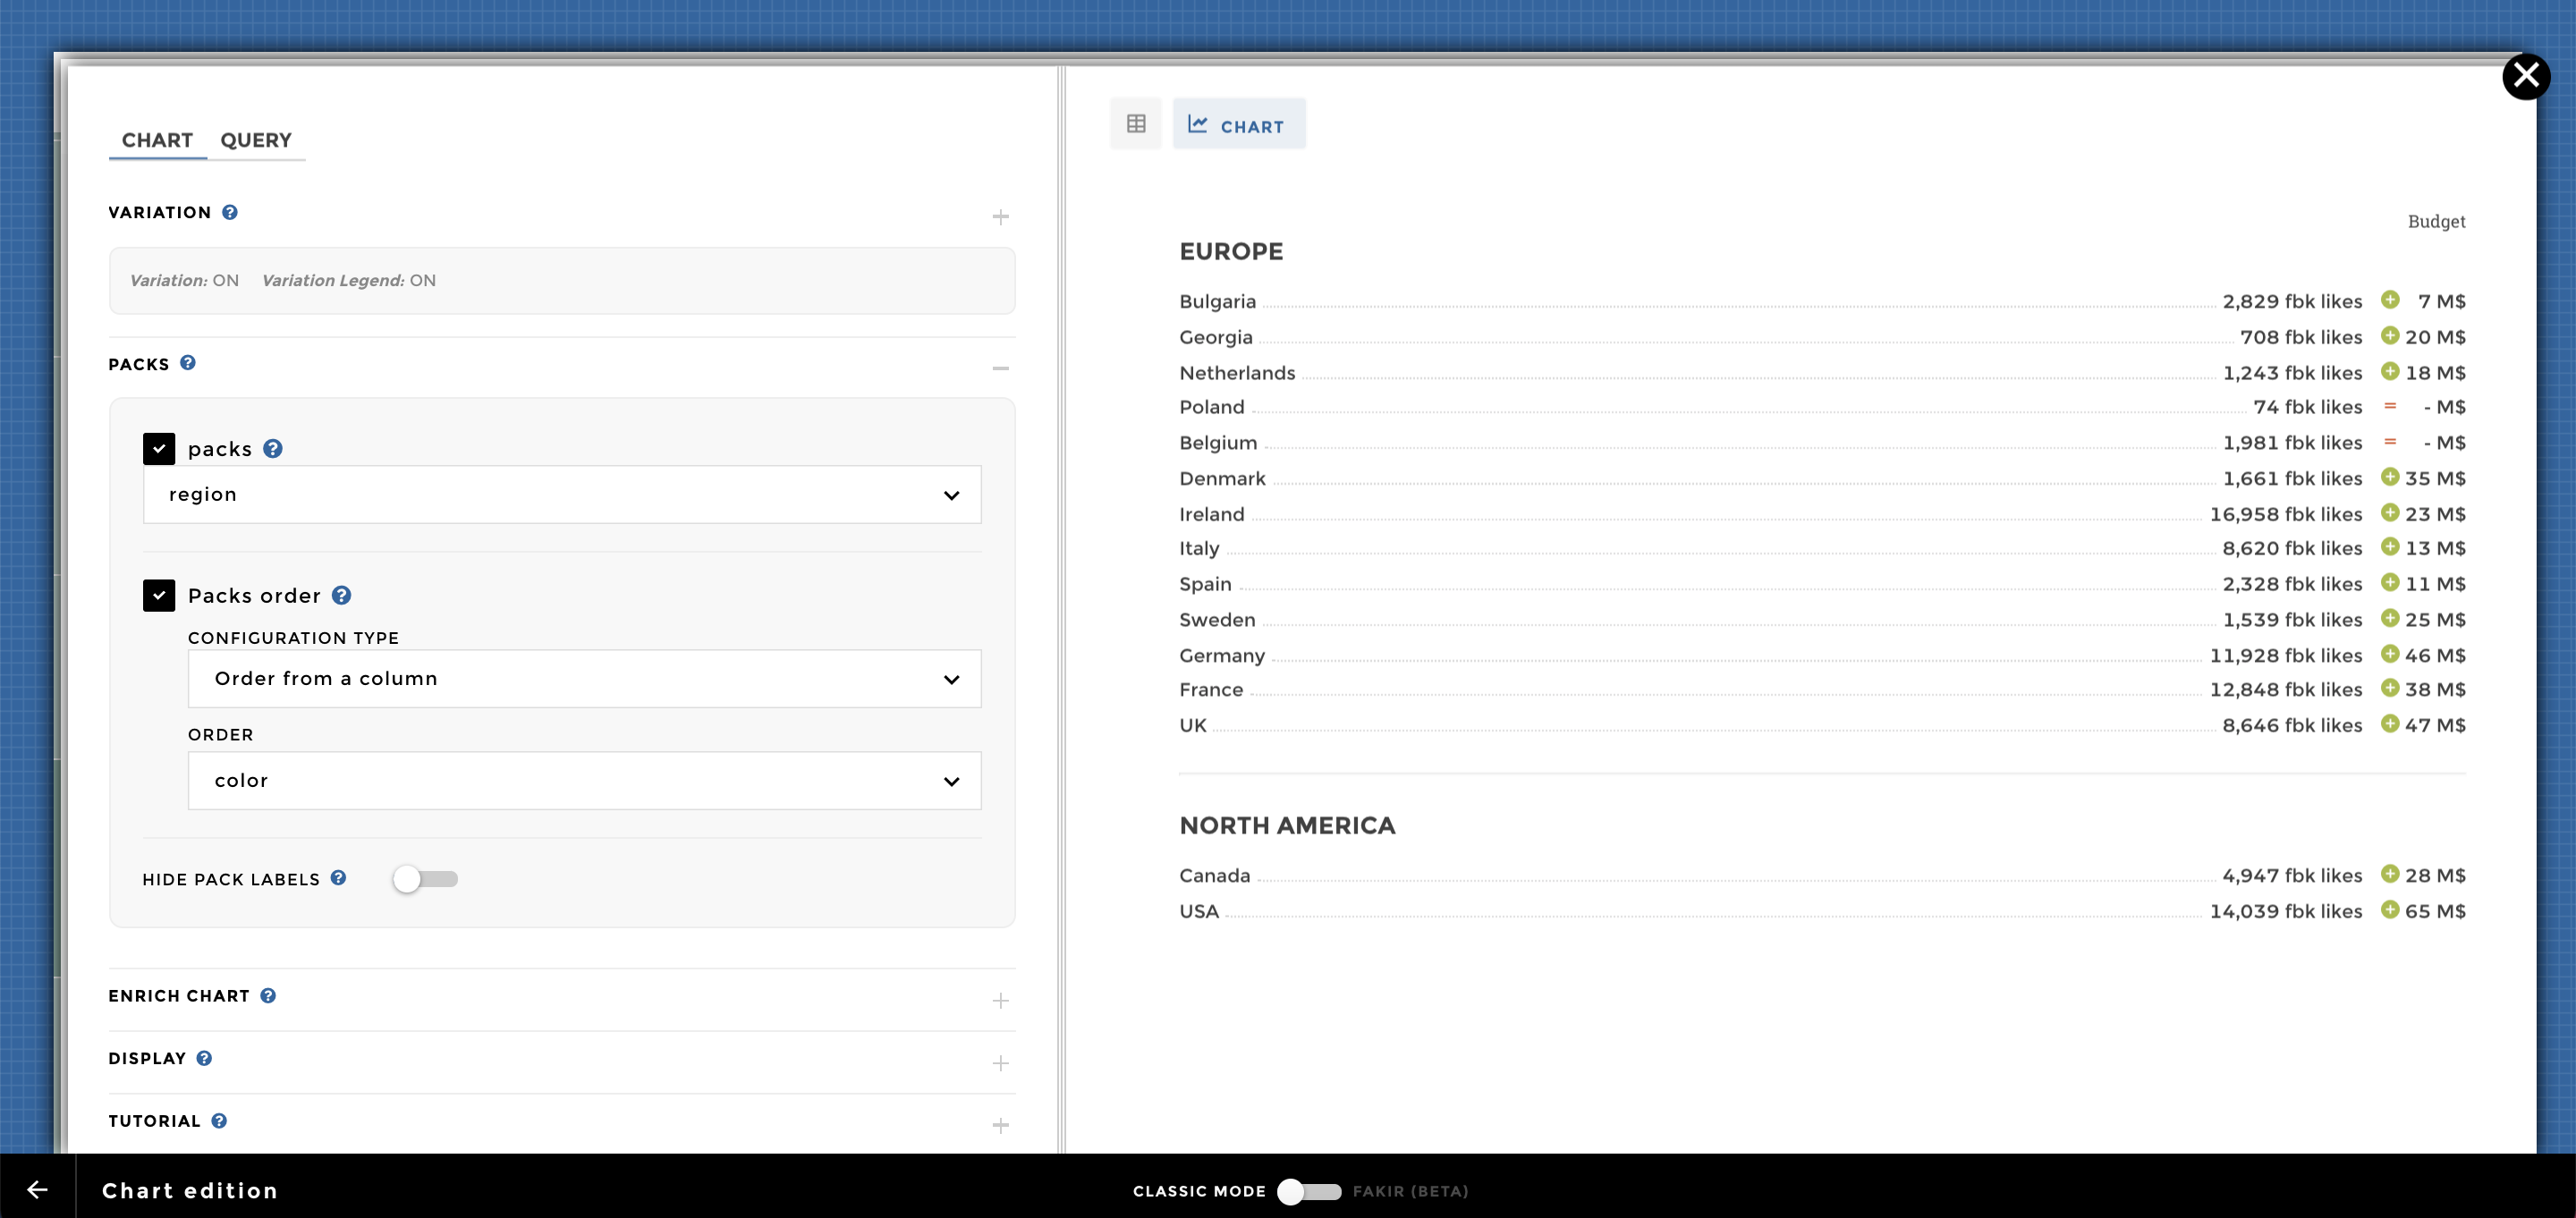
Image of chart scorecard_column_packsorder
Ex7: With custom packs order and custom labels order
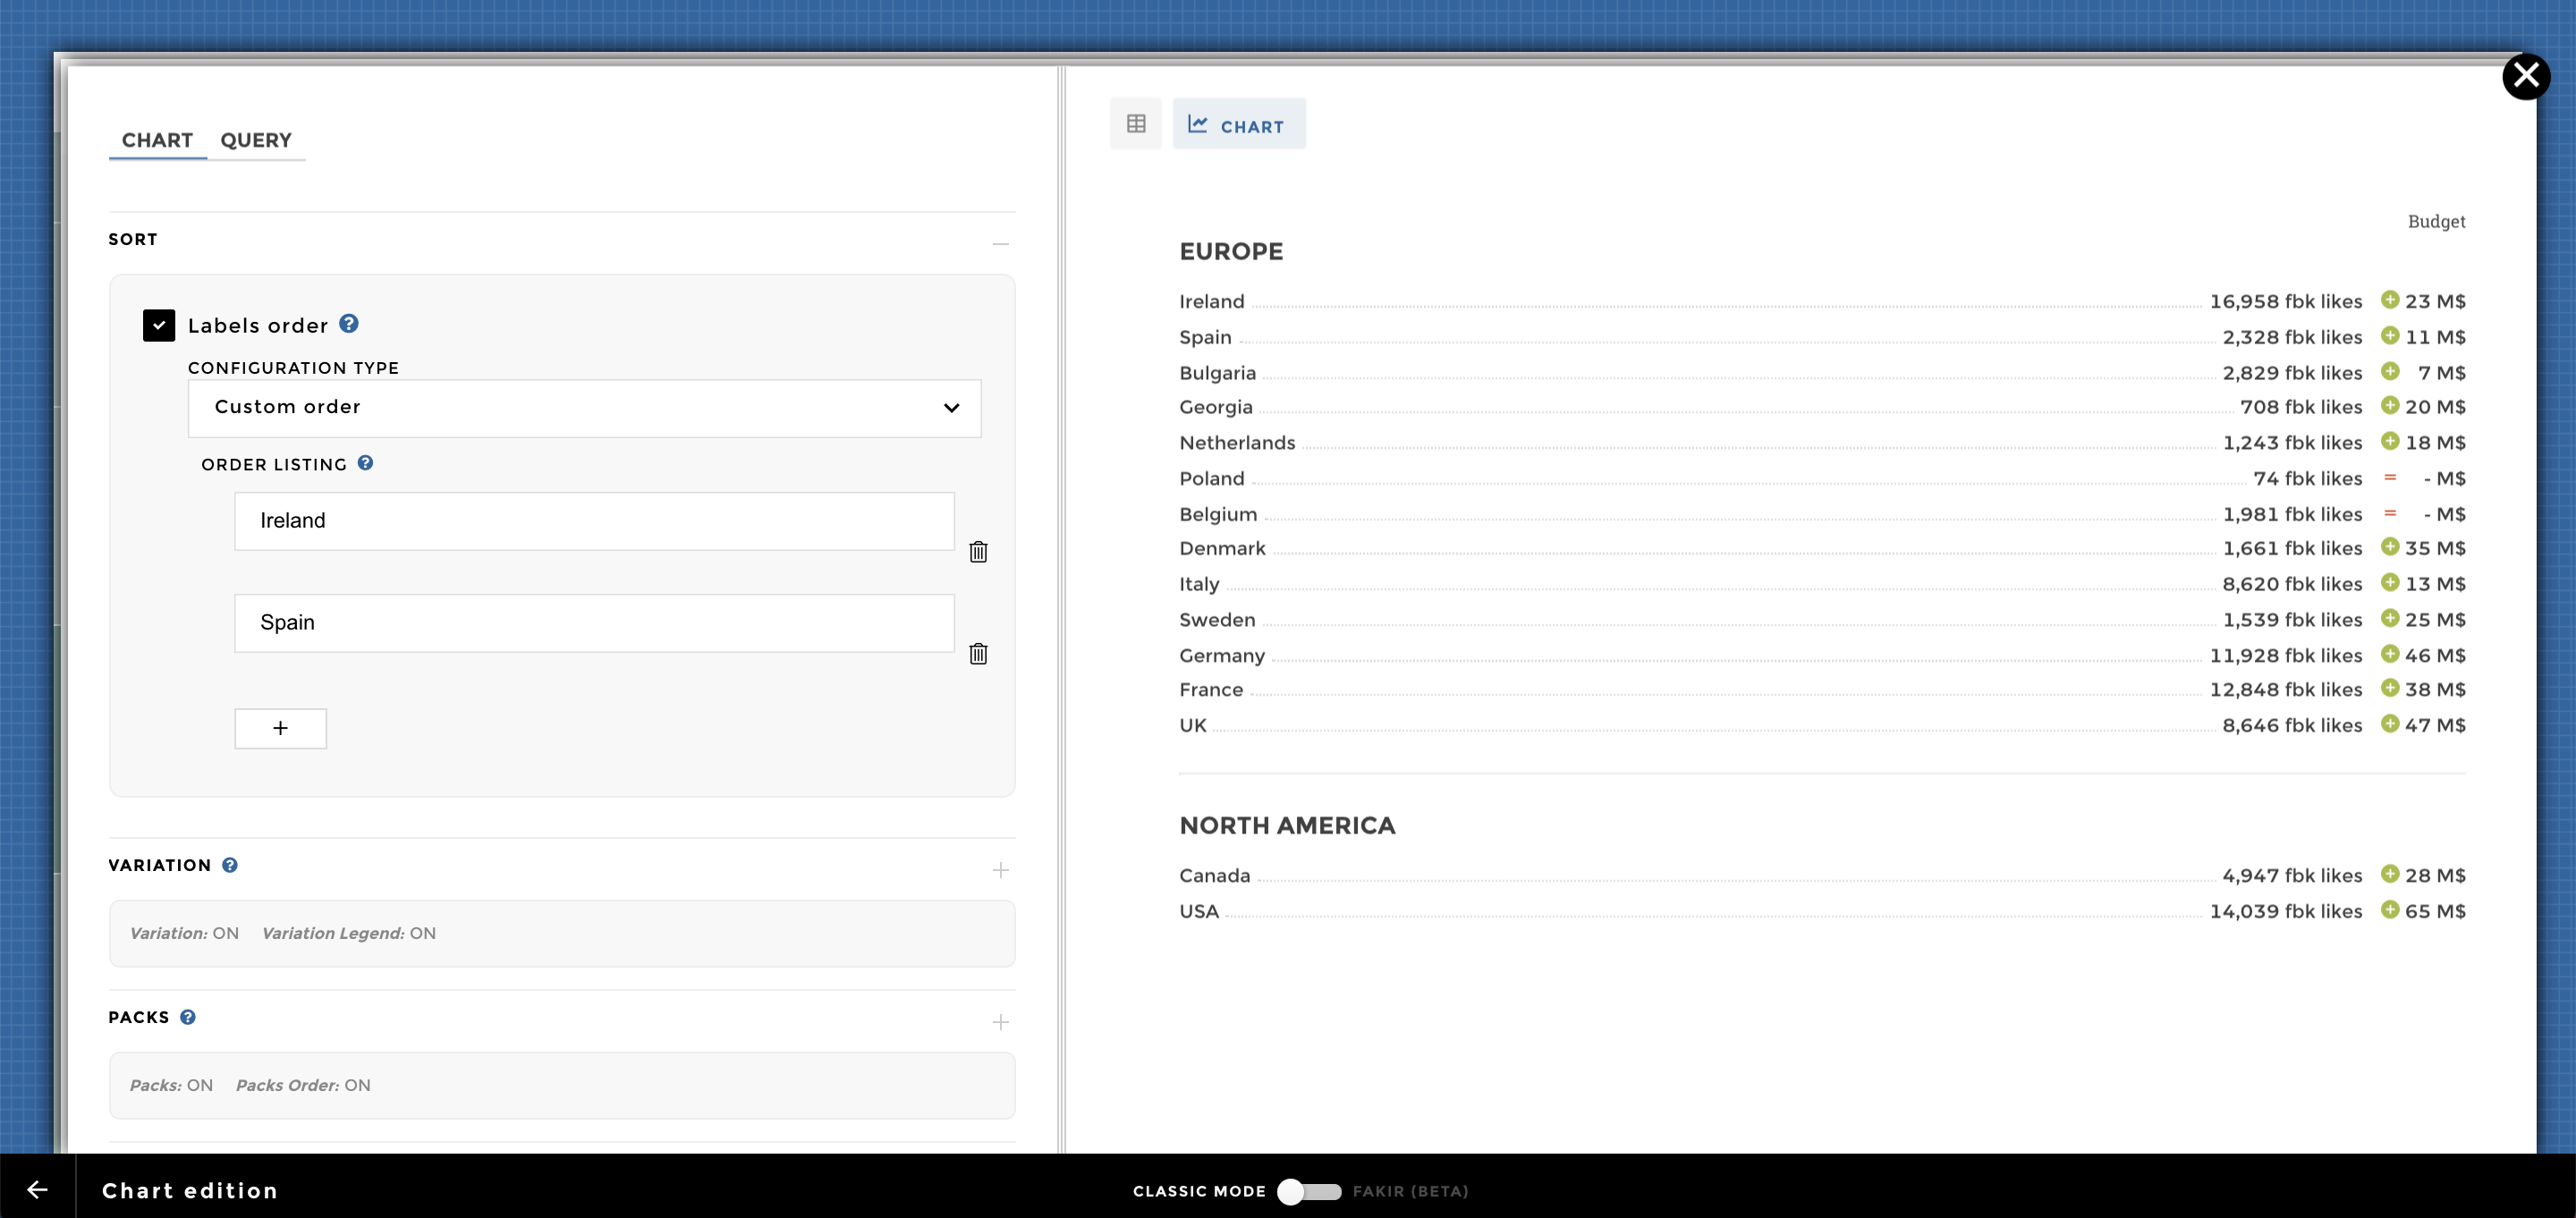
Image of chart
Ex8: With packs order from a column and labels order from a column
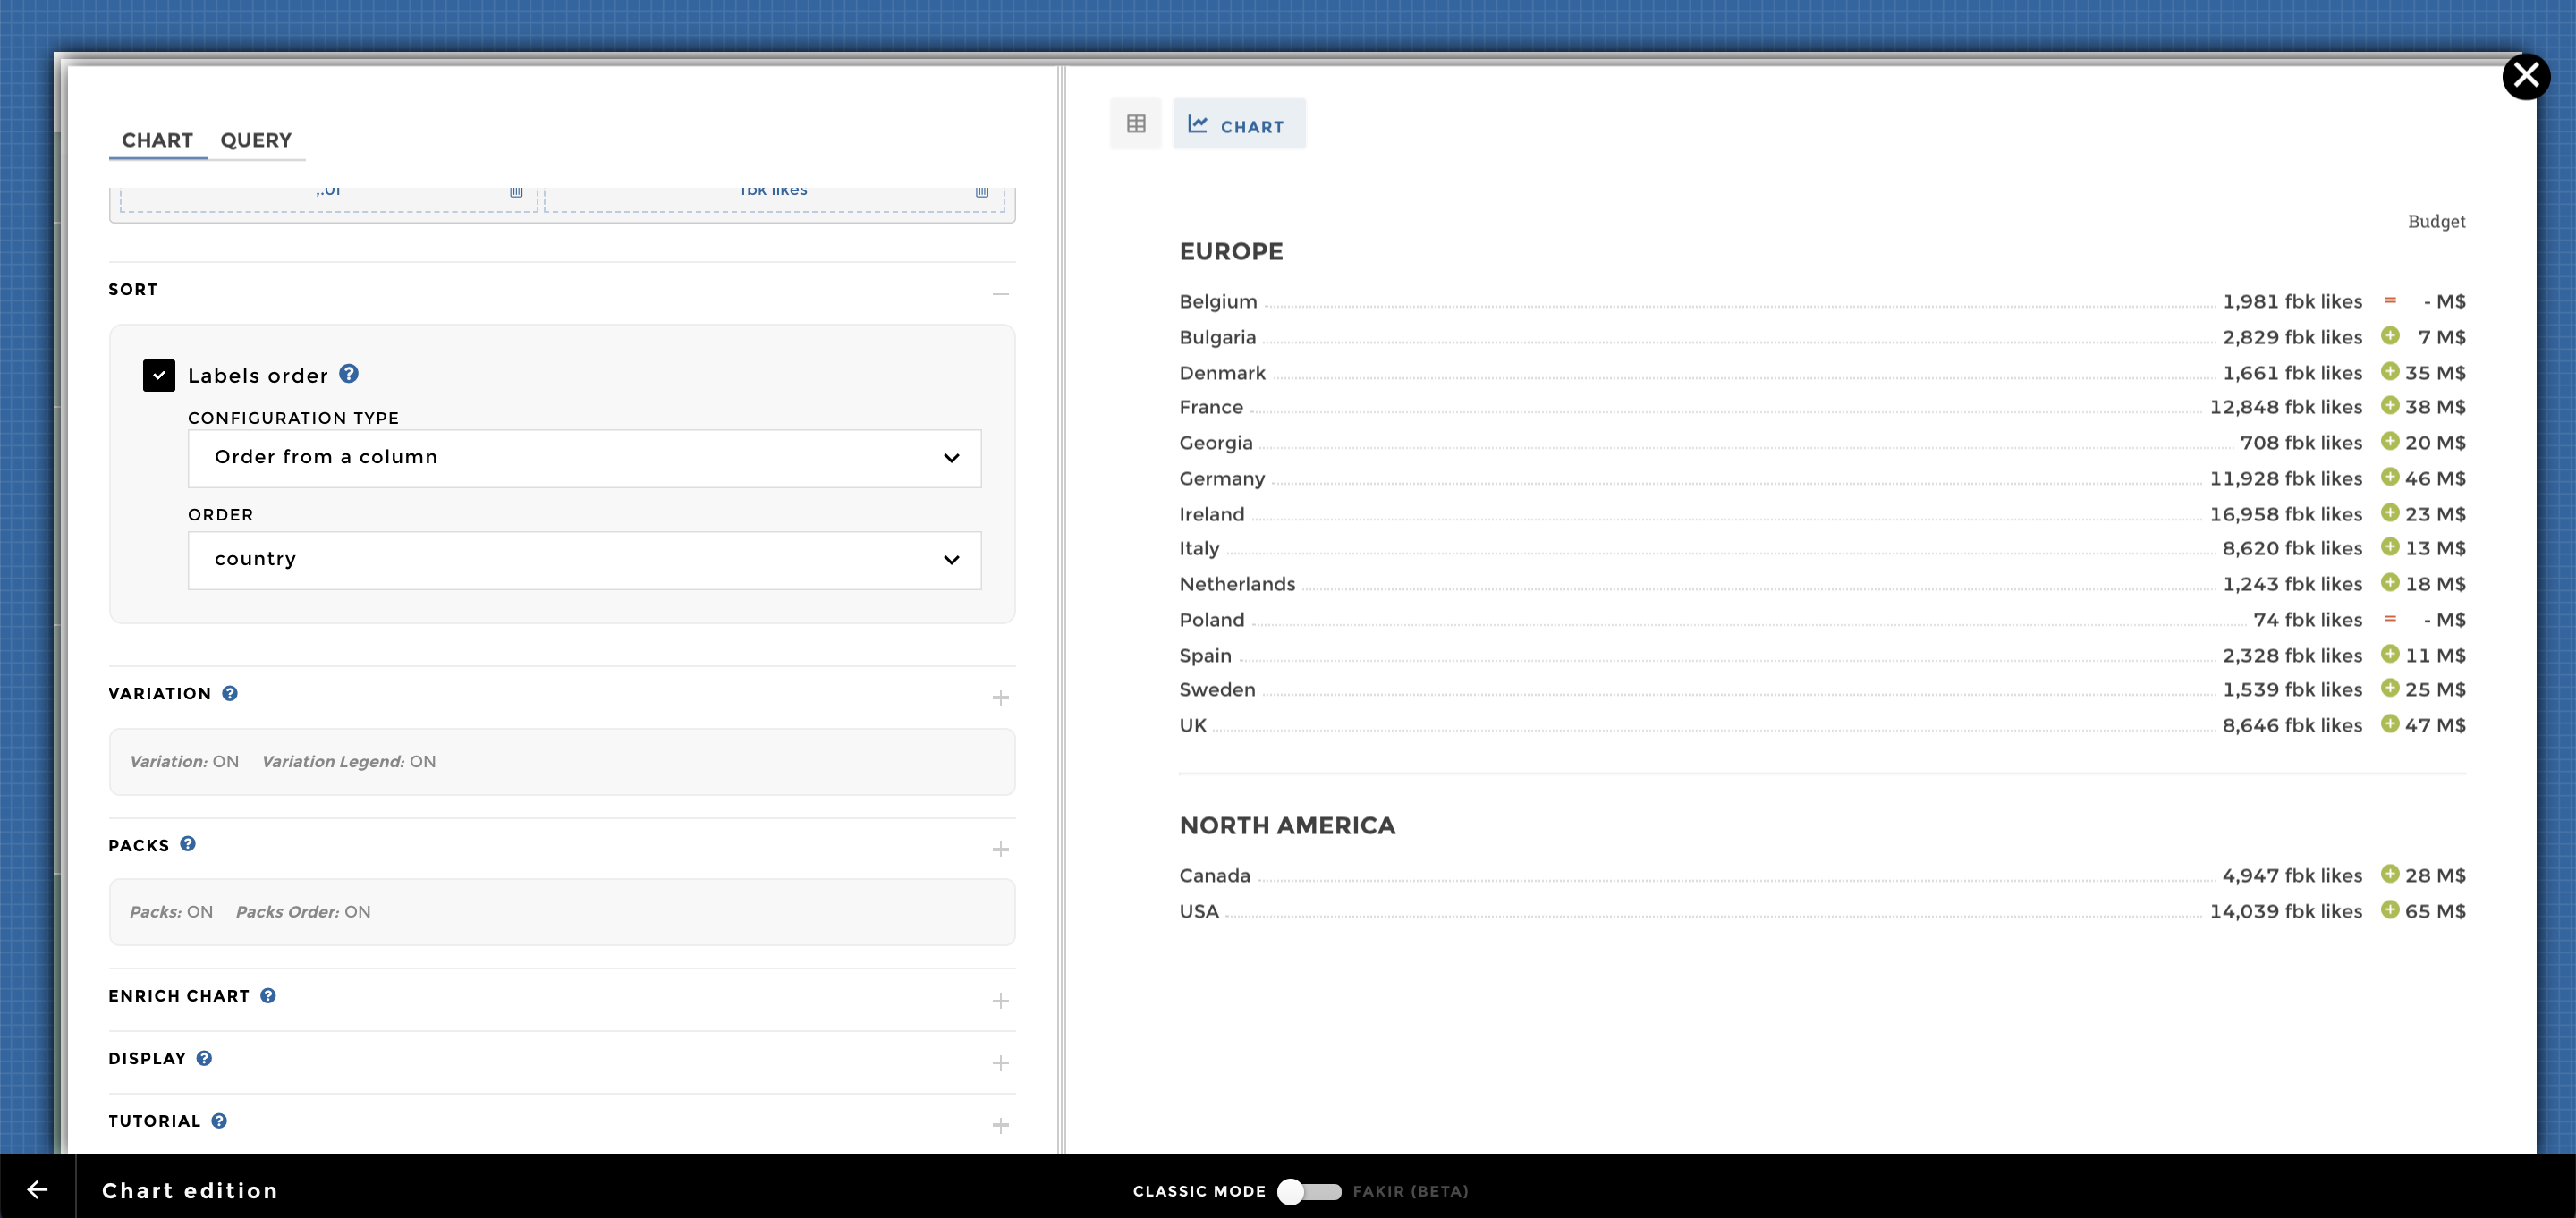
Image of chart scorecard_column_packsorder_order
Ex9: With sentiment
To add some sentiments on your story, you can take a look to this documentation:
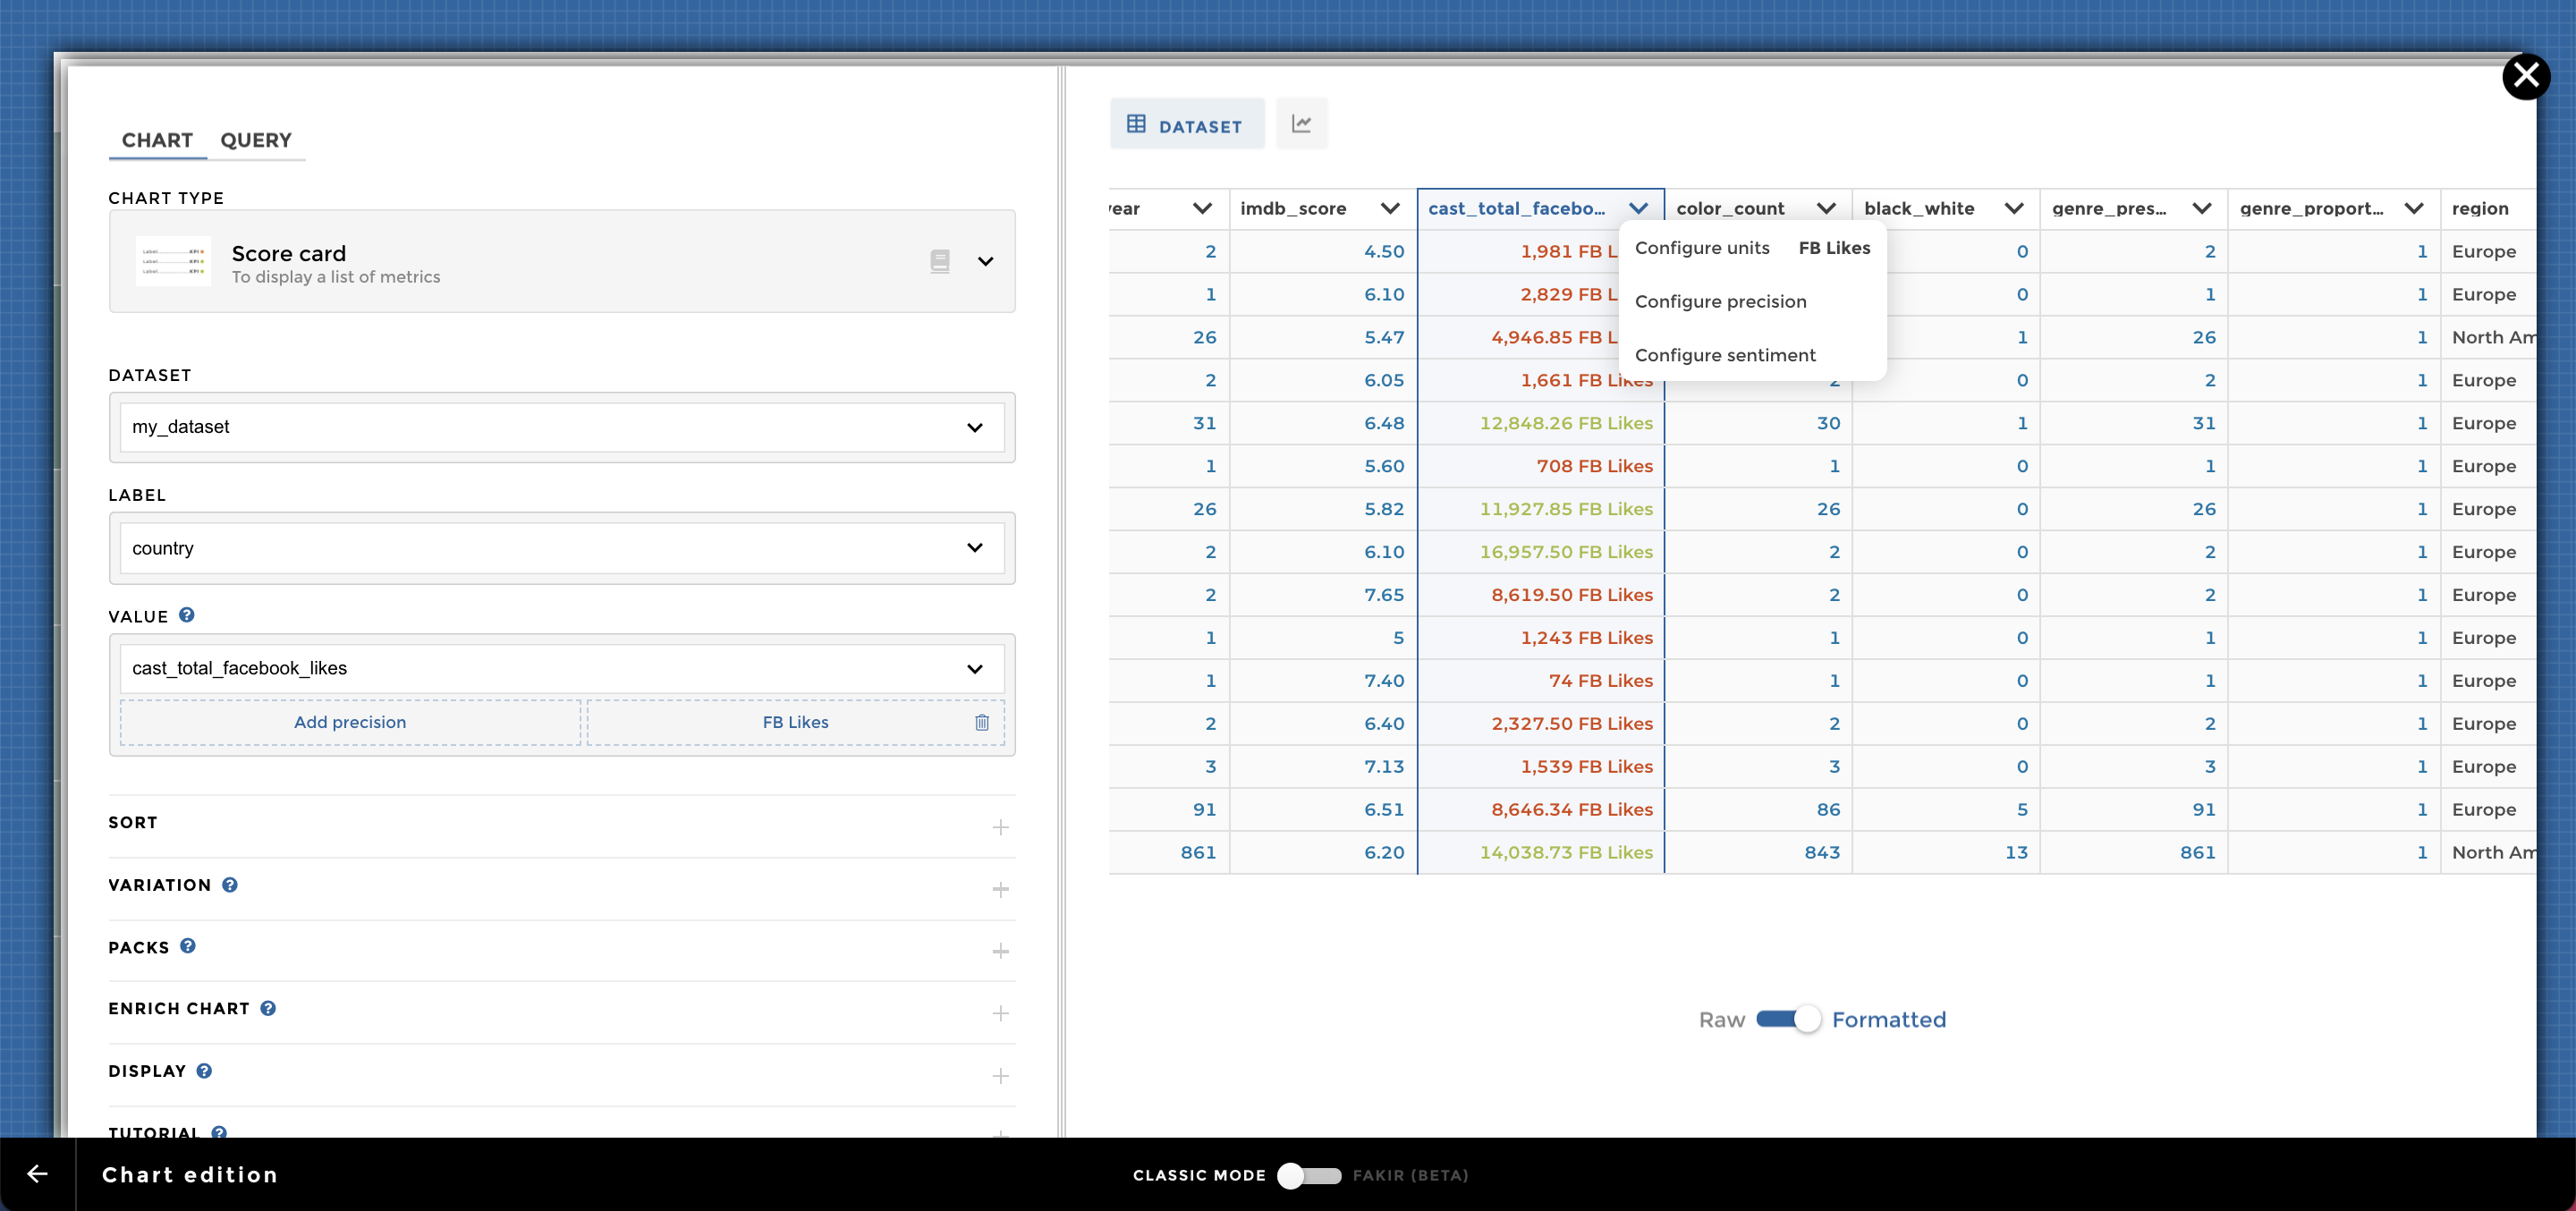
Image of chart scorecard_sentiment1
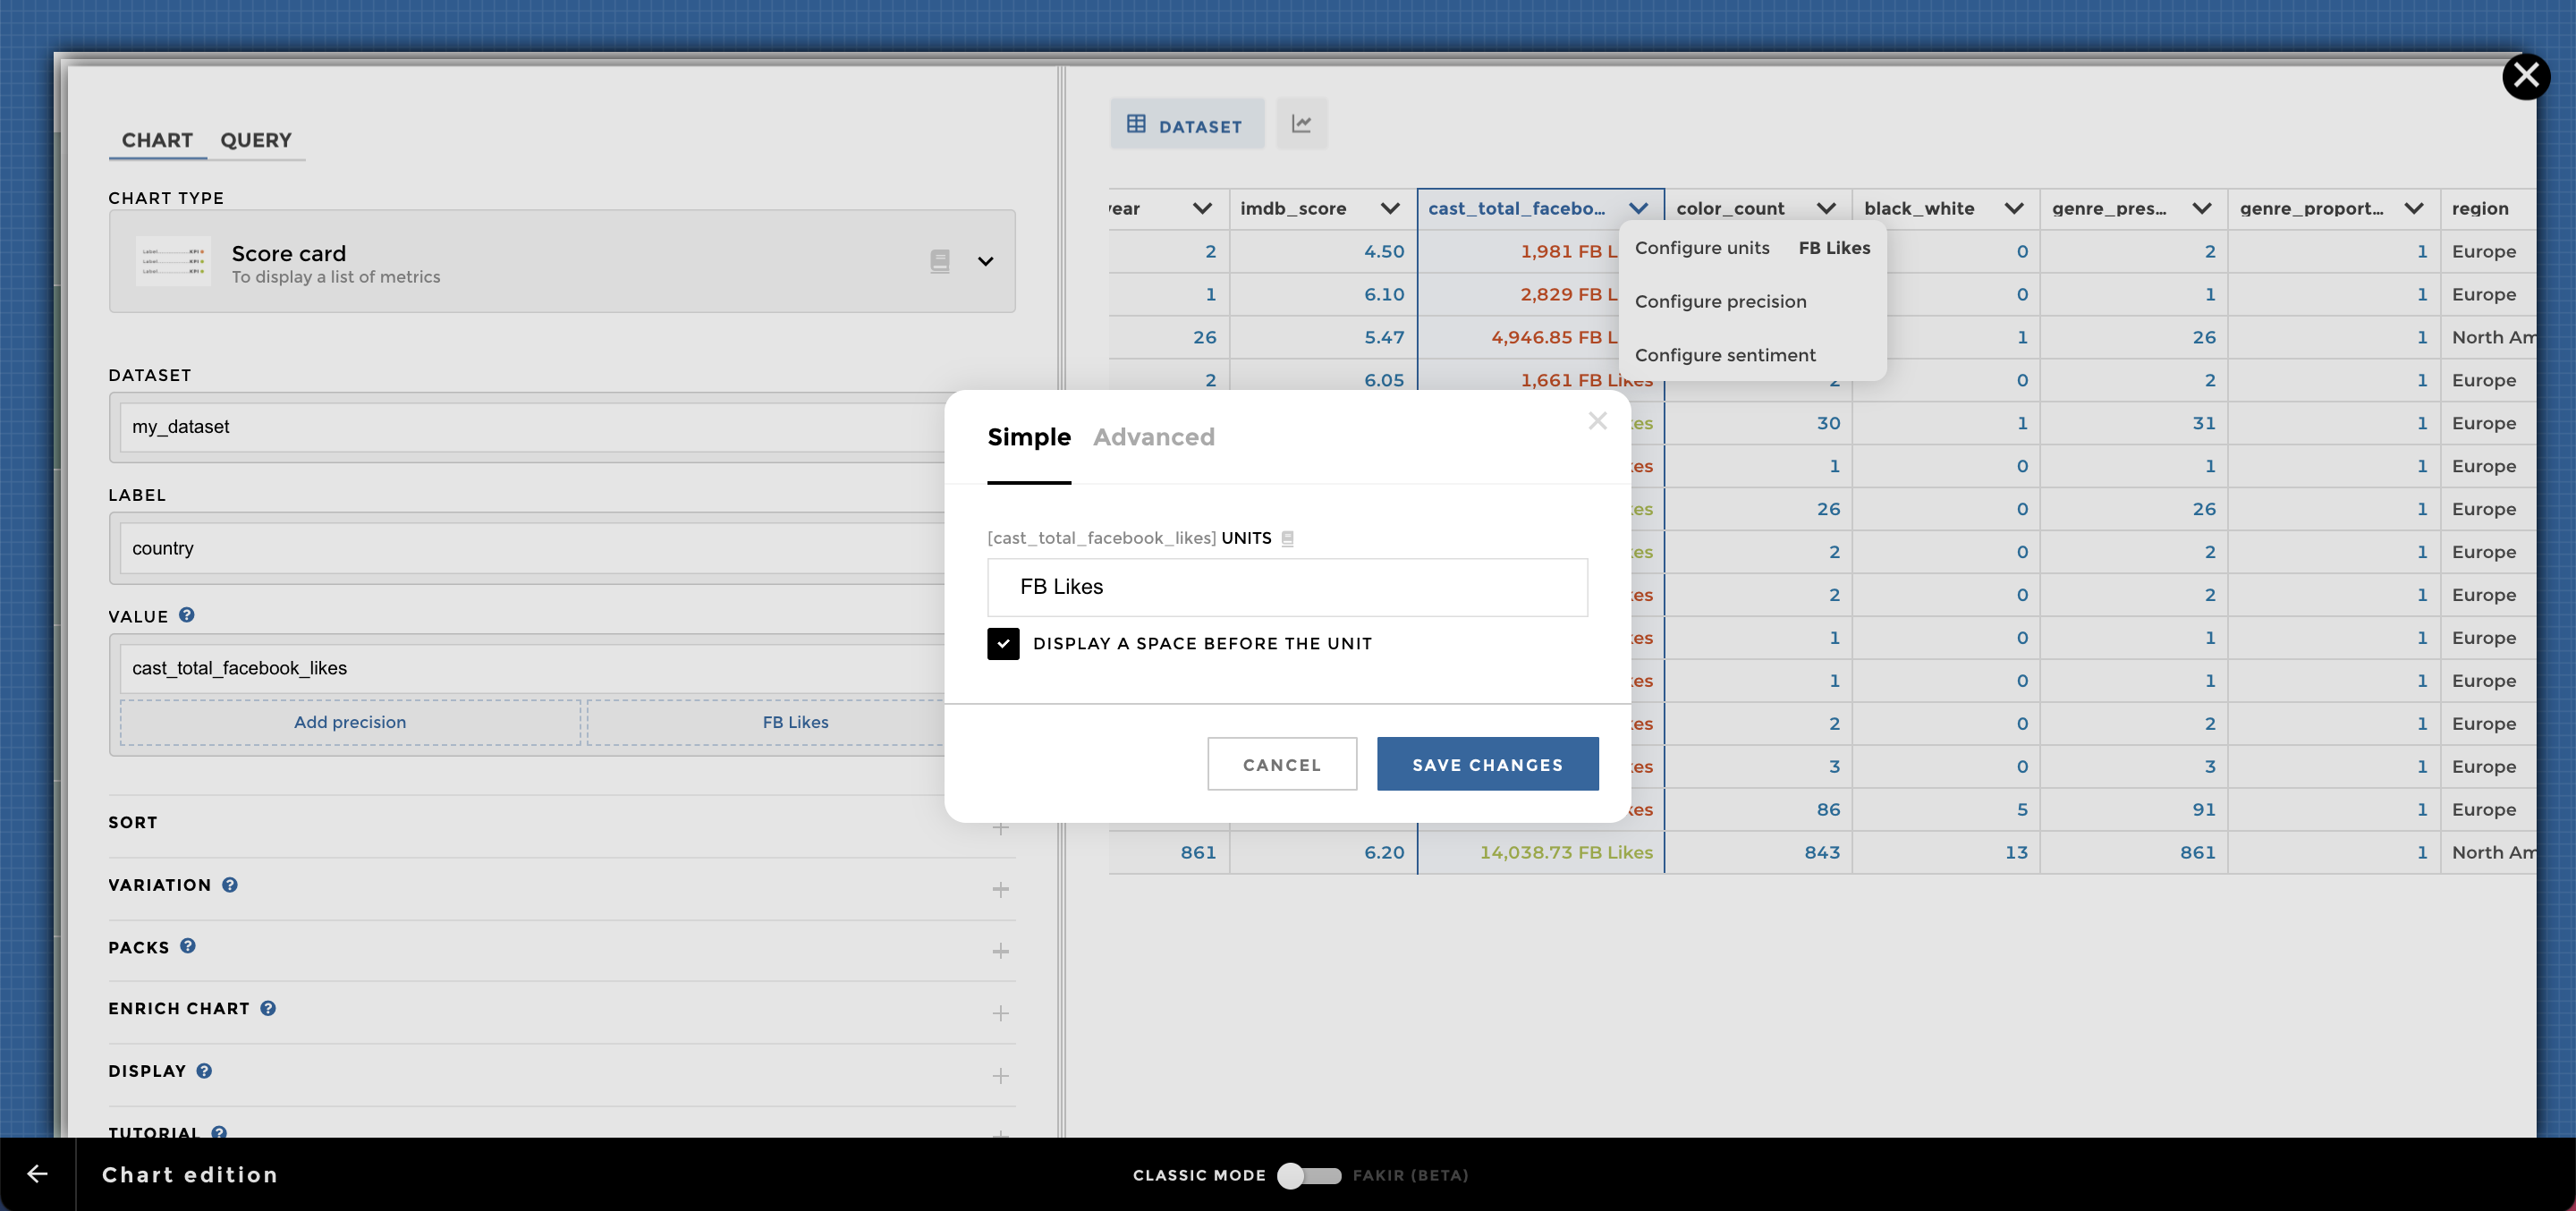
Image of chart scorecard_sentiment2
Sparklines dataset
Data structure used for the sparklines only :
| cast_total_facebook_likes |   country |   genre_type | region       | month
| 1981.0                    | Belgium | Action     | Europe       | Jan
| 3395.0n                   | Bulgaria| Action     | Europe       | Jan
| 1585.0                    | Belgium | Action     | Europe       | Feb
| 2263                      | Bulgaria| Action     | Europe       | Feb
Ex10: With sparklines
If you want more information about sparklines, please take a look to this tutorial:
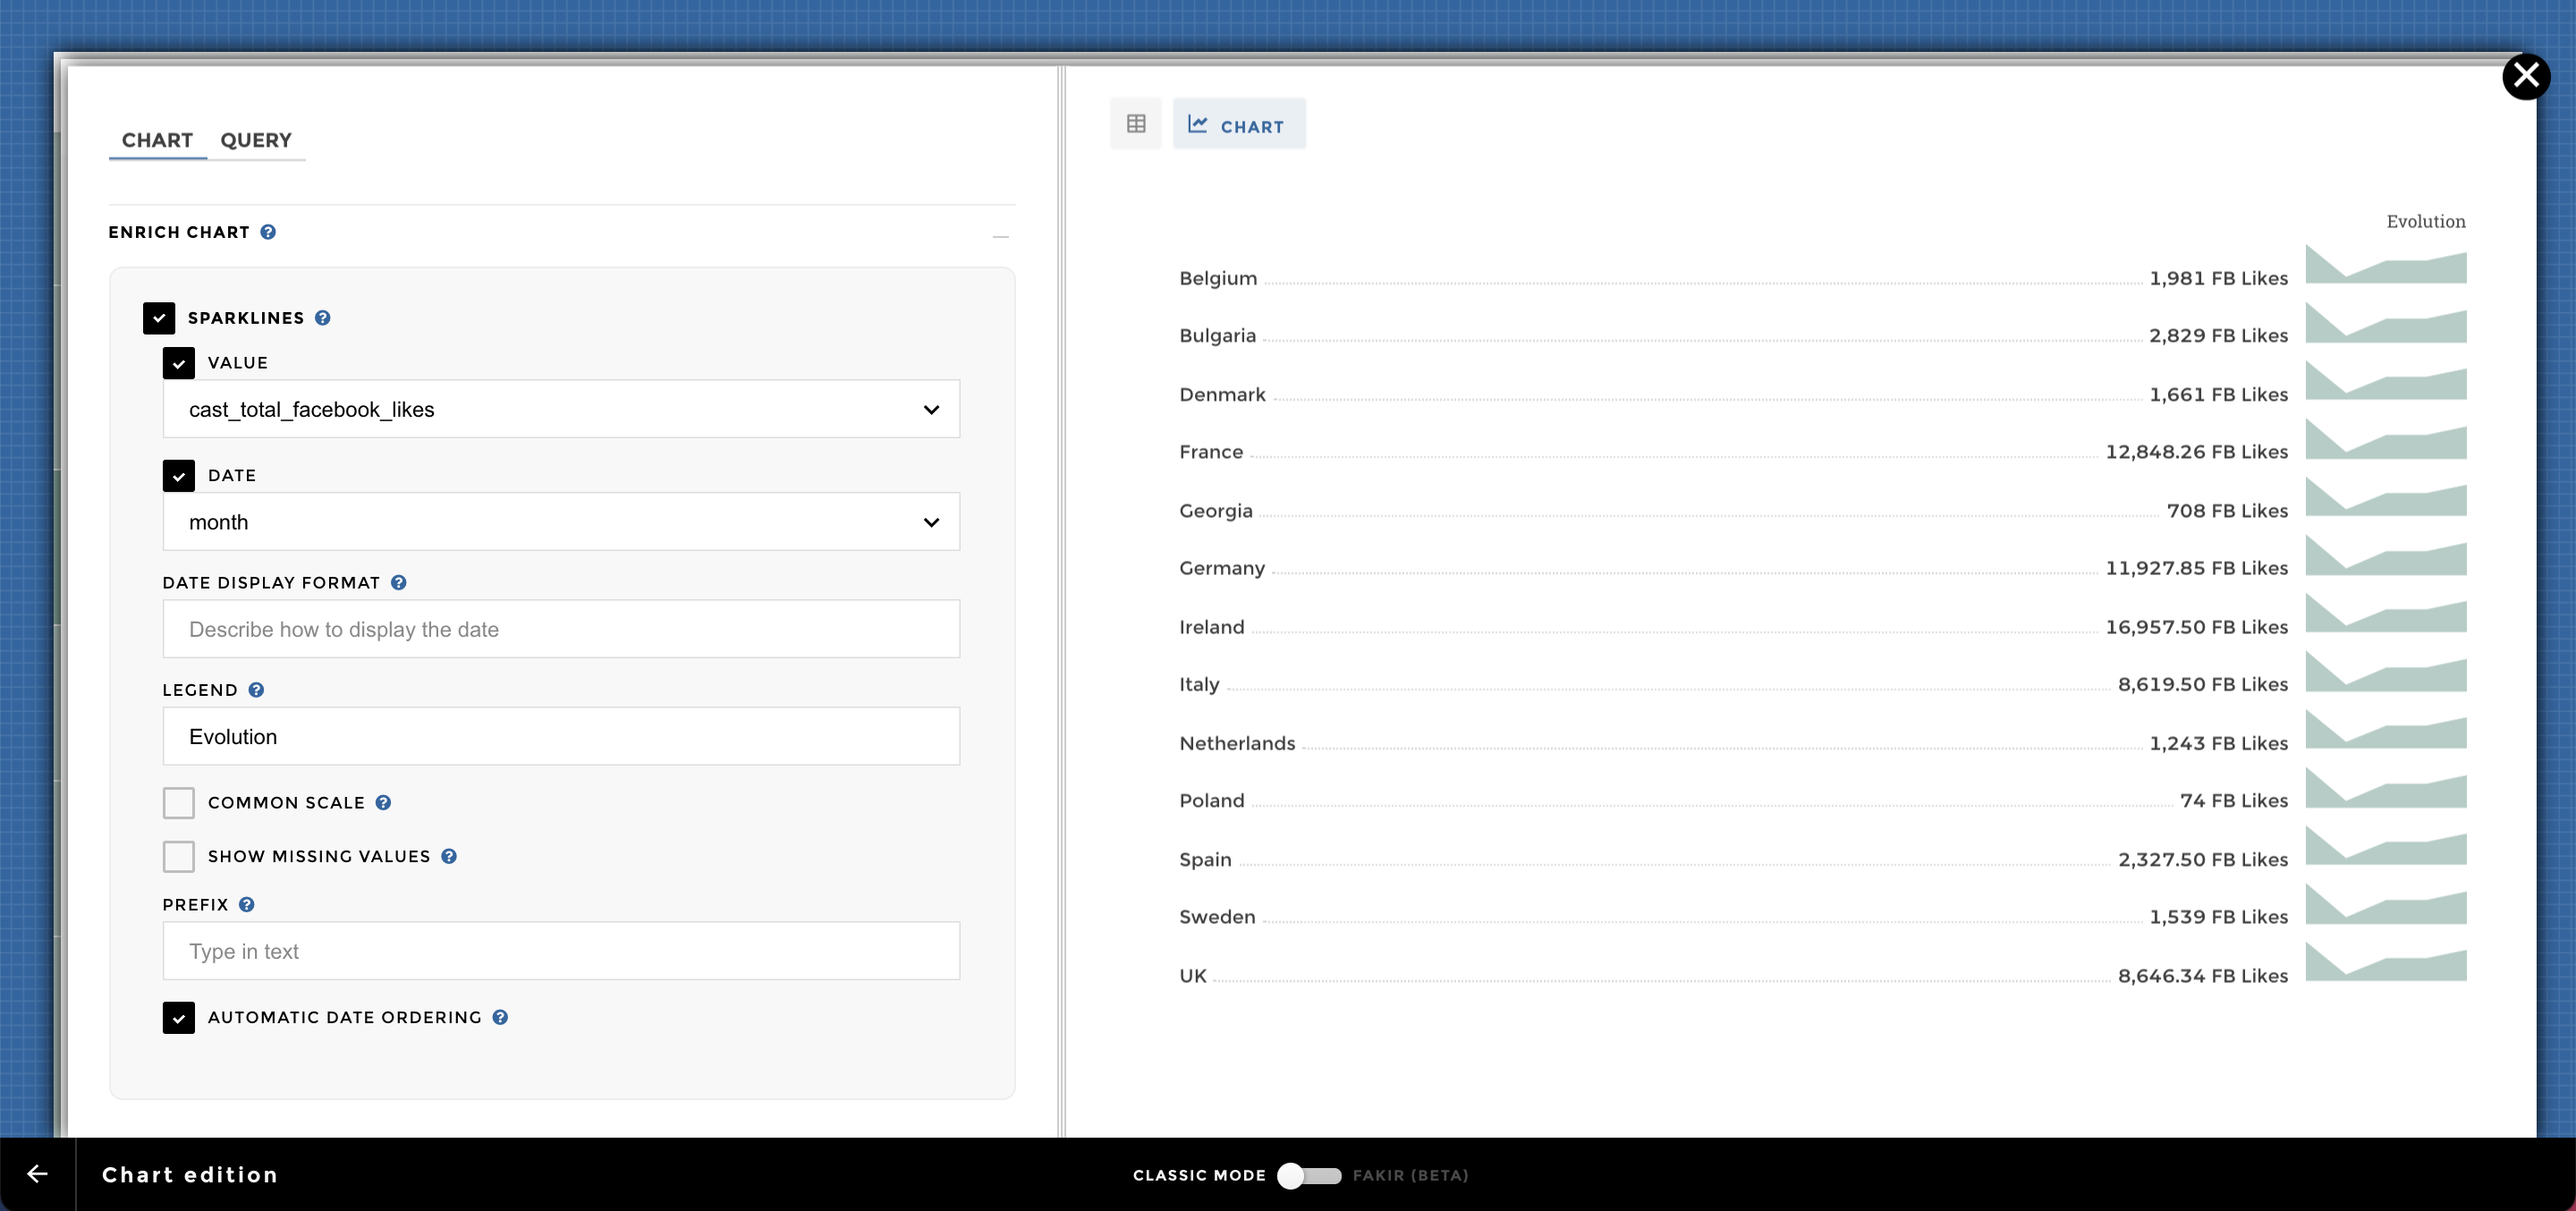
Image of chart scorecard_sparklines