How to :: add highlighted KPIs
Overview
This feature highlights important information, or add extra information to your story (e.g. compare the data appearing on the screen with data from previous years).It can be a numerical value or some text.
You can add up to 3 HKPIs in one story, if you want more maybe think about creating a dedicated story with a scorecard or another viz ? 📱 On mobile you can scroll left and right on the HKPIs to show more
💡 Did you know?
Step by step tutorial
The user story
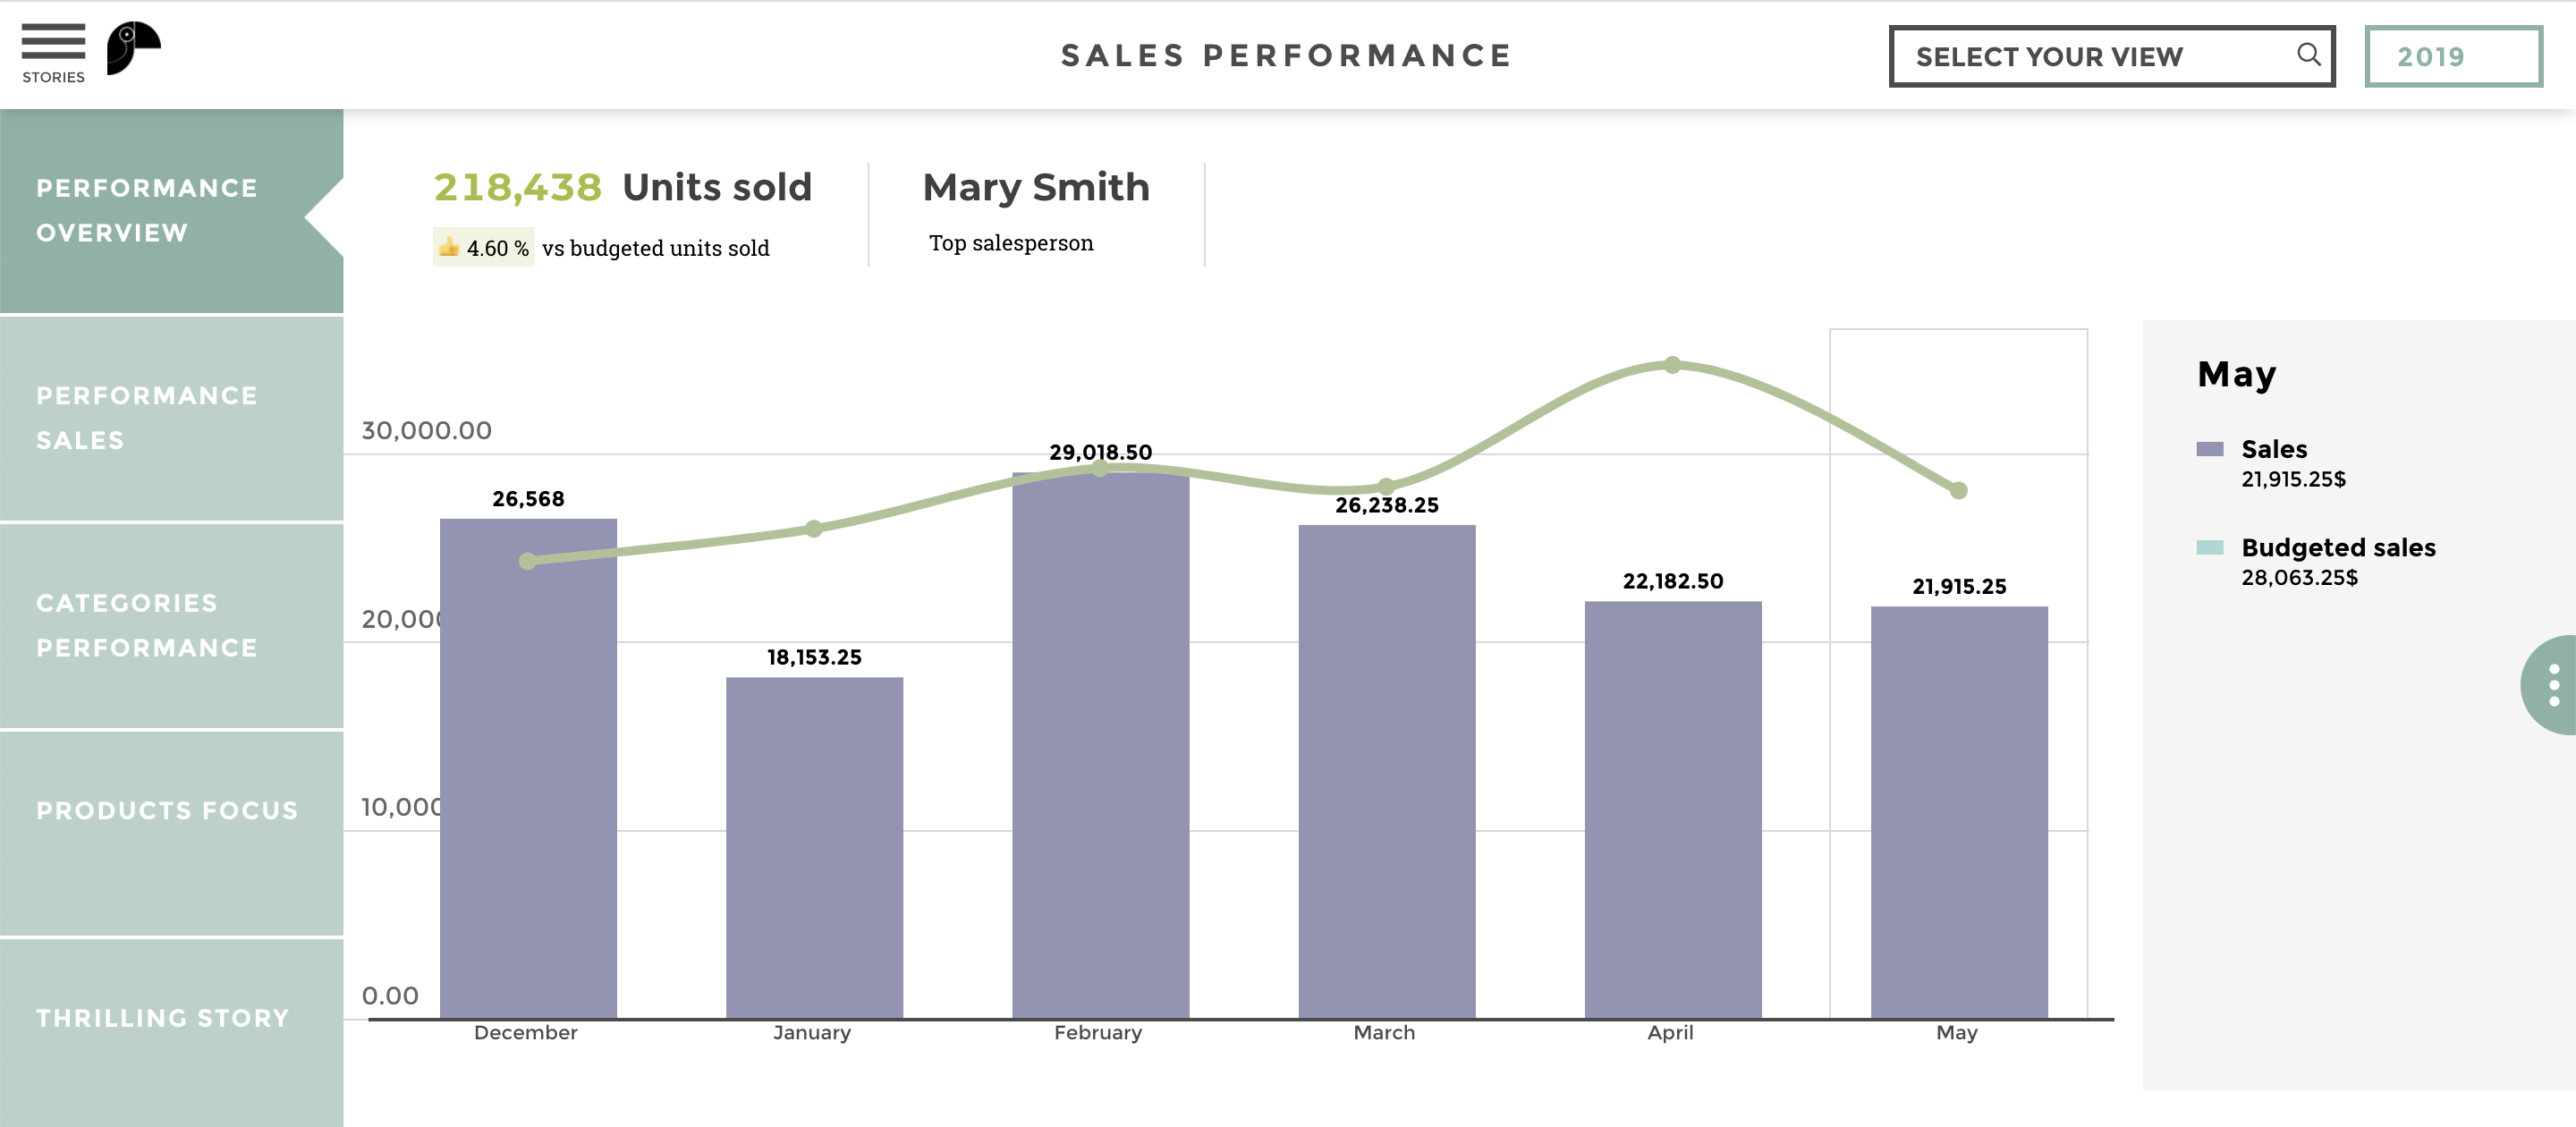
I have a story containing the trend of my sales and budgeted sales. I’d love to add the total of units sold and the name of the top salesperson.
Let’s add 2 HKPI to our story!
Pick some data
| SALESPEOPLE | VALUE | BUDGET | VARIATION |
|---|---|---|---|
| Mary Smith | 218438 | 200000 | 4,6 |
This dataset is used for all the following examples
The objective of the new tile value is to highlight an indicator, and possibly its evolution(s).
This is why the HKPIs only displays one line of data! If you have more than one, you will have to aggregate or filter rows.
💡 Did you know?
You can select a new dataset, or re-use an existing query
Confifguration
Requirements
1/ Have a dataset imported into Toucan, and one line of data so far (or by default the first lign will be displayed).
2/ Create an HKPI on your story and use the uploaded dataset.
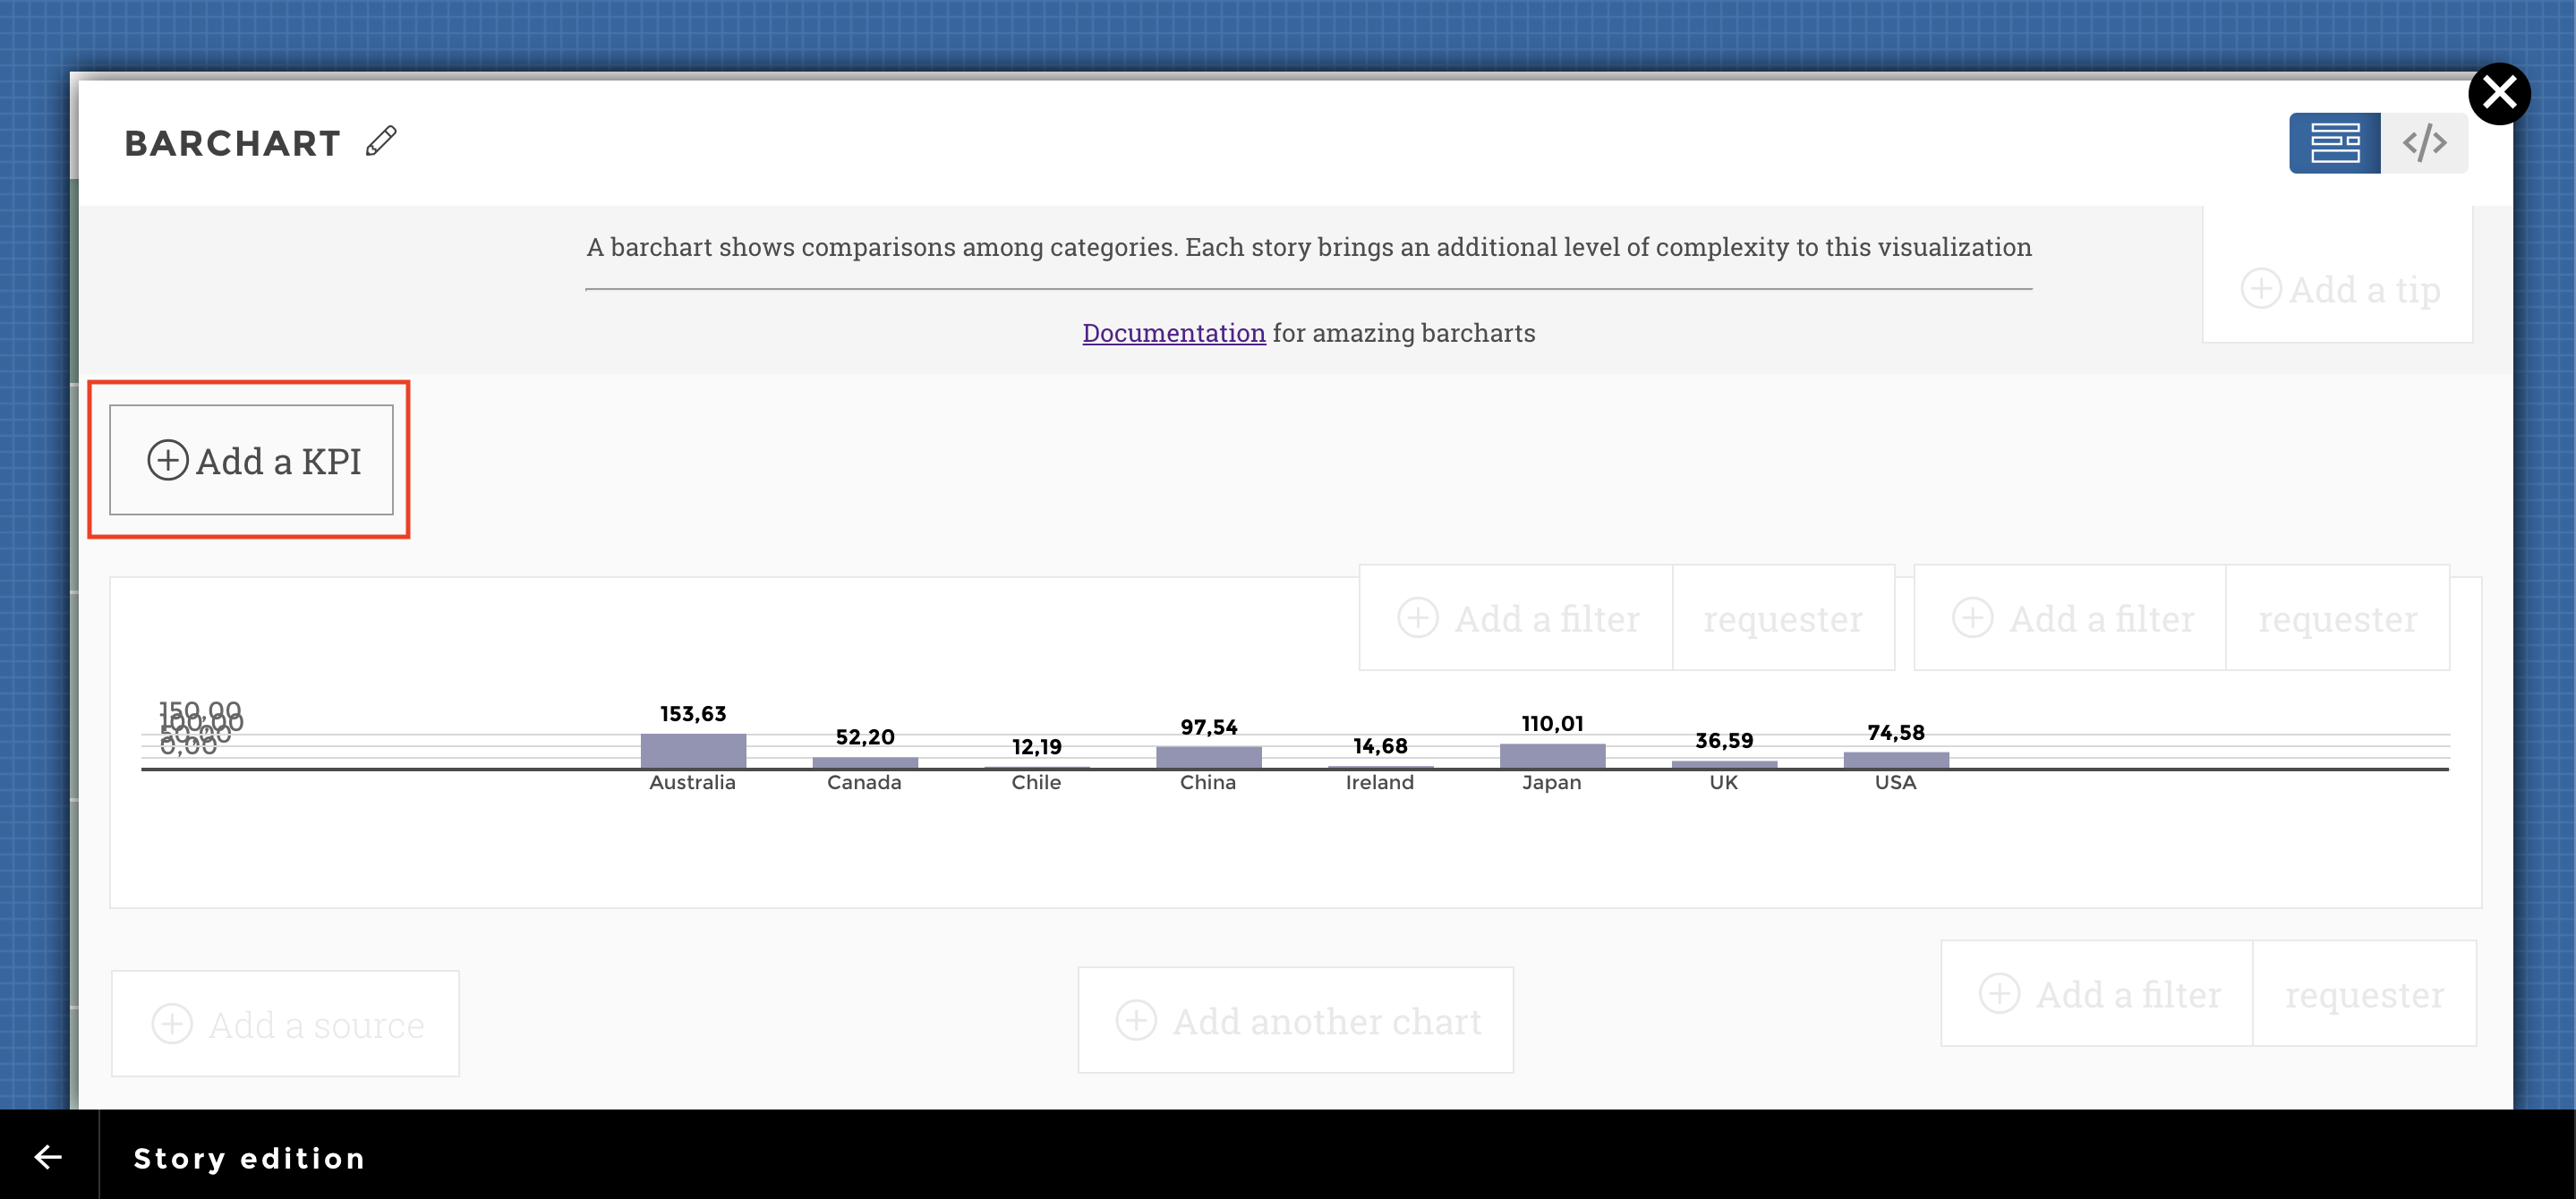
Then we can start! 🙌
Mandatory options
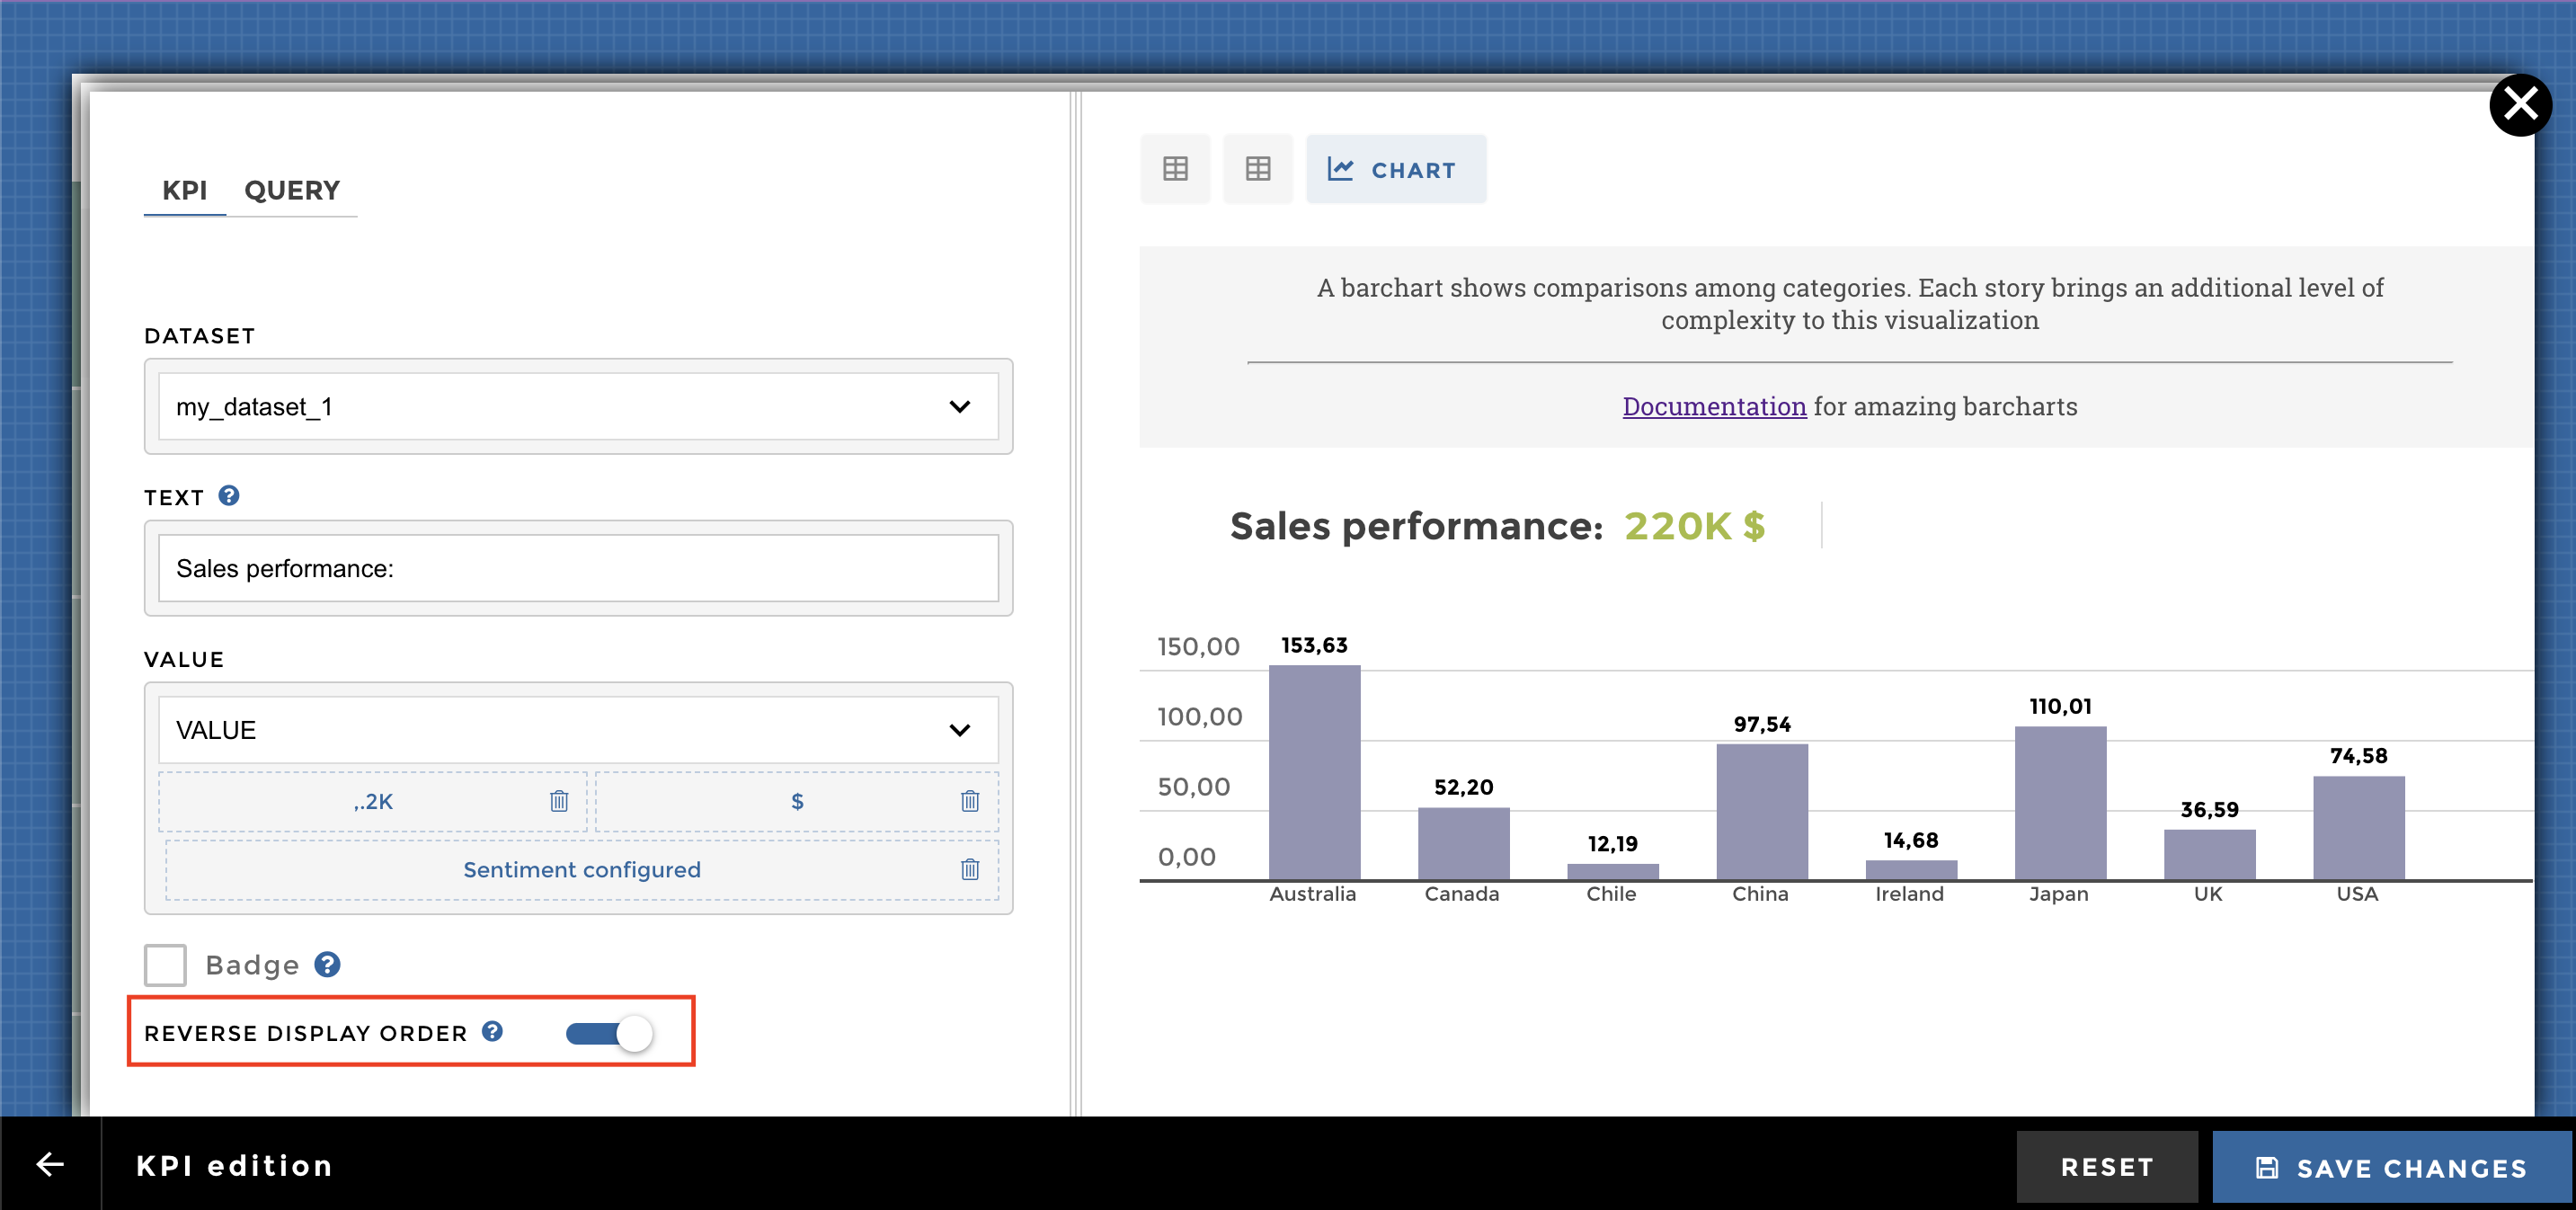
1/ Fill in the value field with the column containing the value to
be displayed, for instance revenue
- You can add units and/or precisions to better display your value
- You can also add some color coding (sentiment) to really convert your value into insights. In our example we will add color coding regarding budgeted sold units.
2/ Fill in the text field with info to contextualize your KPI
- It’s actually optional but we strongly believe context is key
3/ Choose if you want to display the text first
Badge
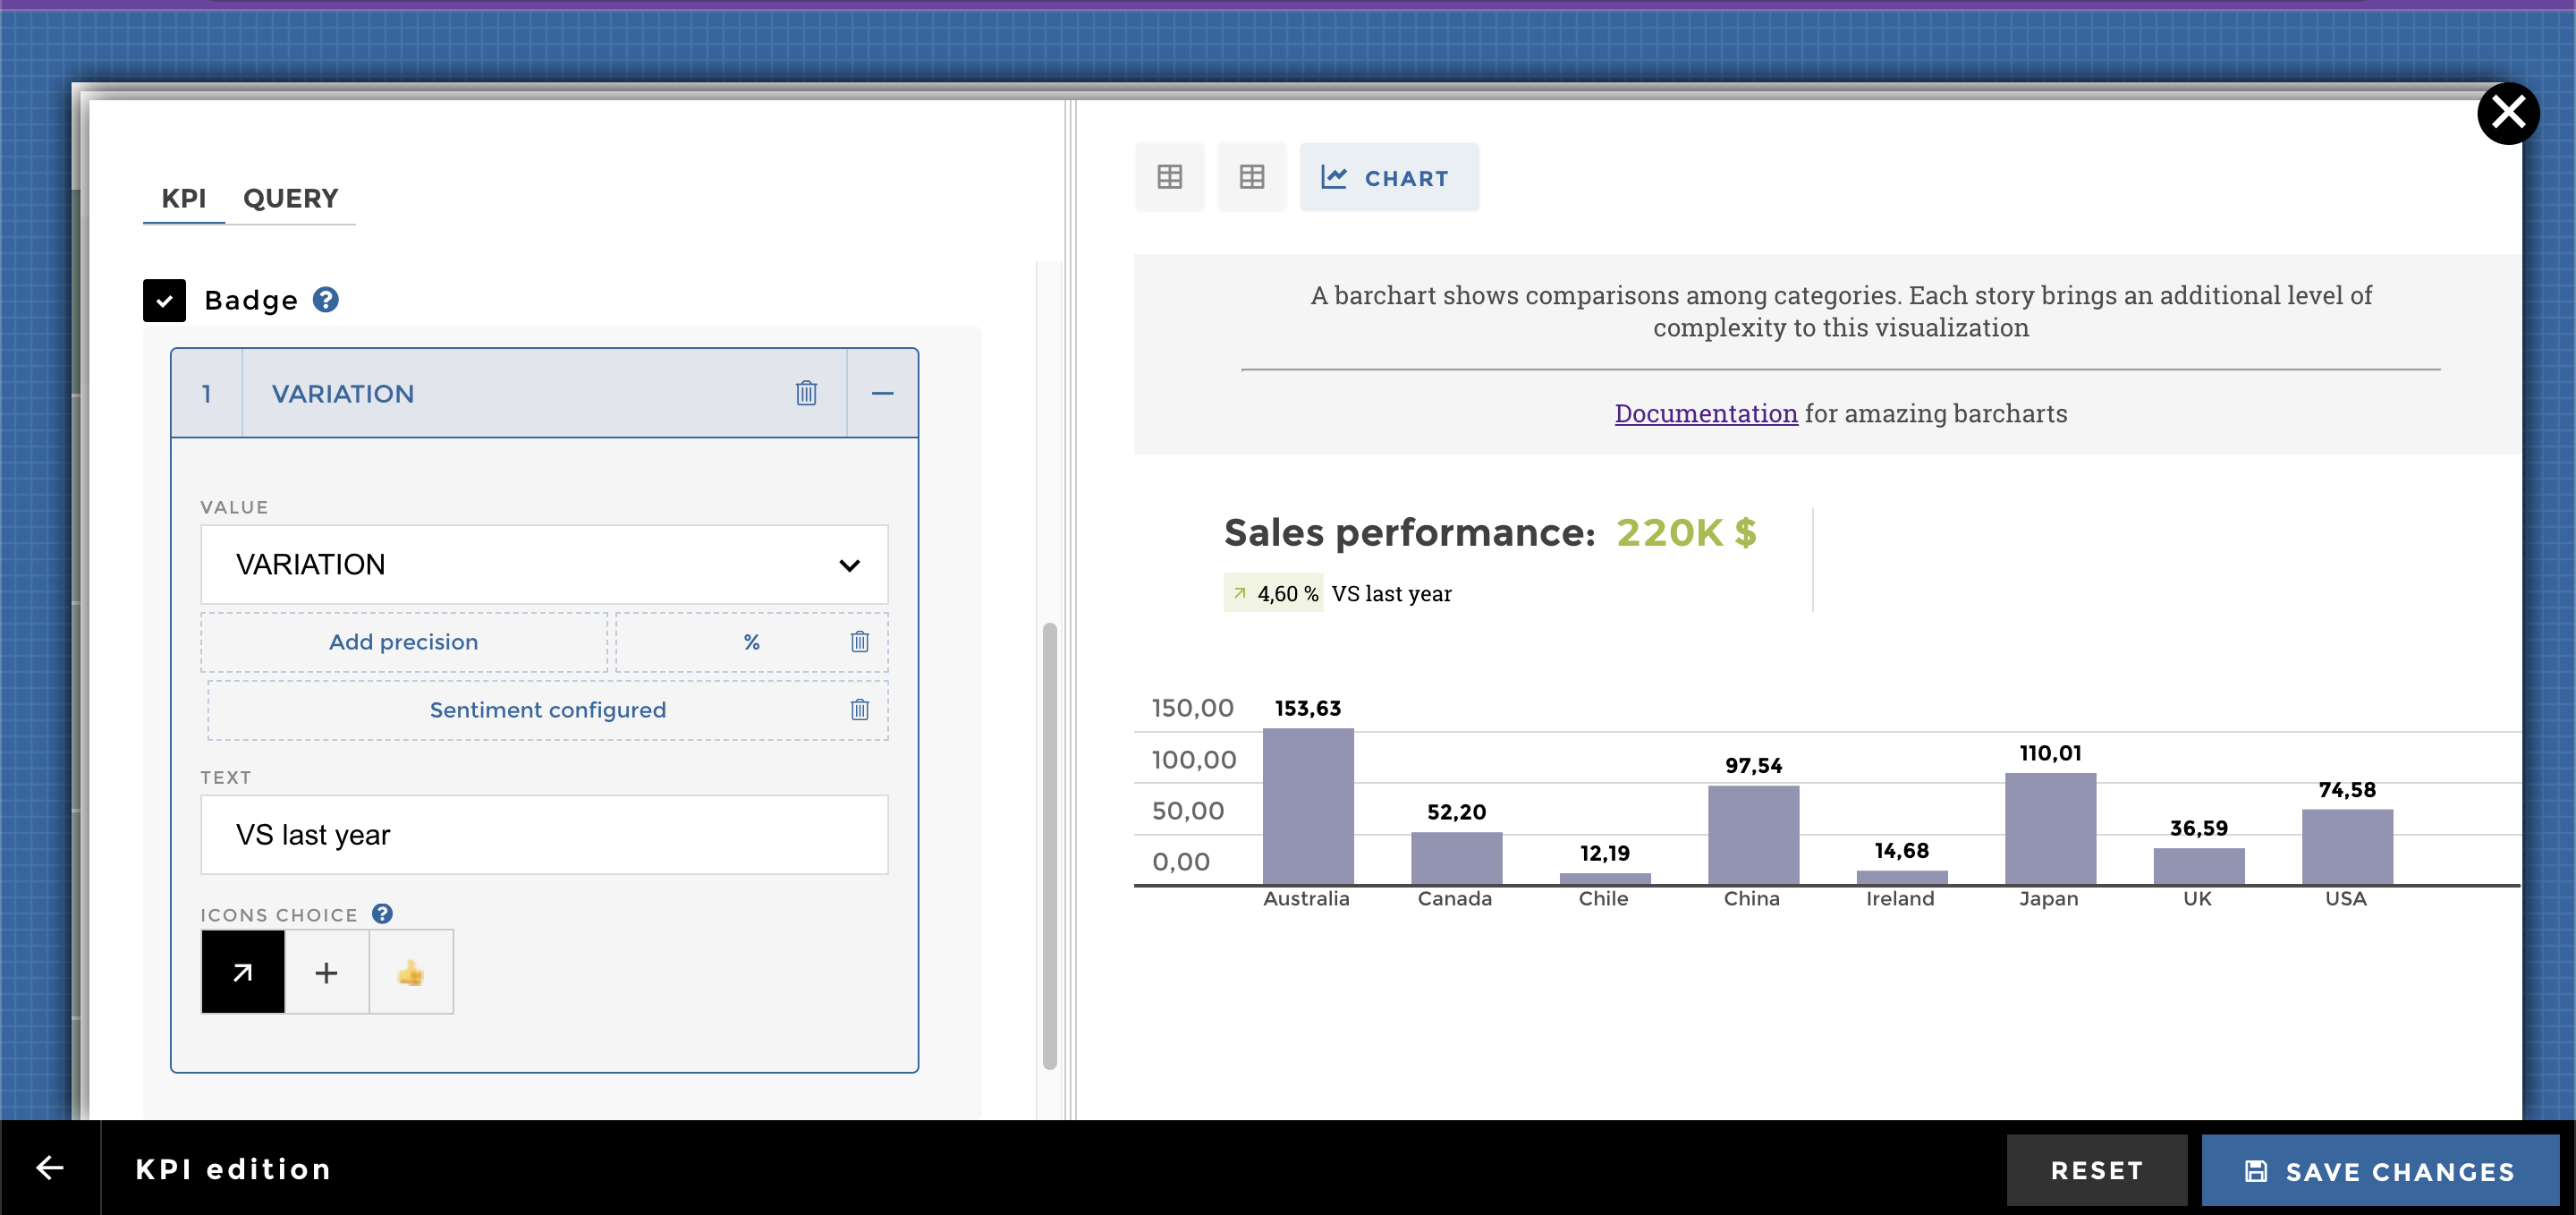
You would love to add more contextual information, dynamic or static, under your indicator right ? Or even an icon to indicate the variation of your numbers ?
What’s the evolution of my KPI versus last year ? or budget ?
Guess what !?! It’s possible 🔥 you can add up to 1 badge (vs 2 for the dynamic value tile).
Badge contain a value, a text and a color coding.
Warning
Not that variation icon will display only if you’ve configured a sentiment on your badge value.
Congrats, you’ve just built a nice HKPI !