Verbatim
📖 Options Reference | 👩🏫 Tutorials
verbatims
Purpose & Application
It helps you illustrate your performance with client verbatim and explore data in text format.
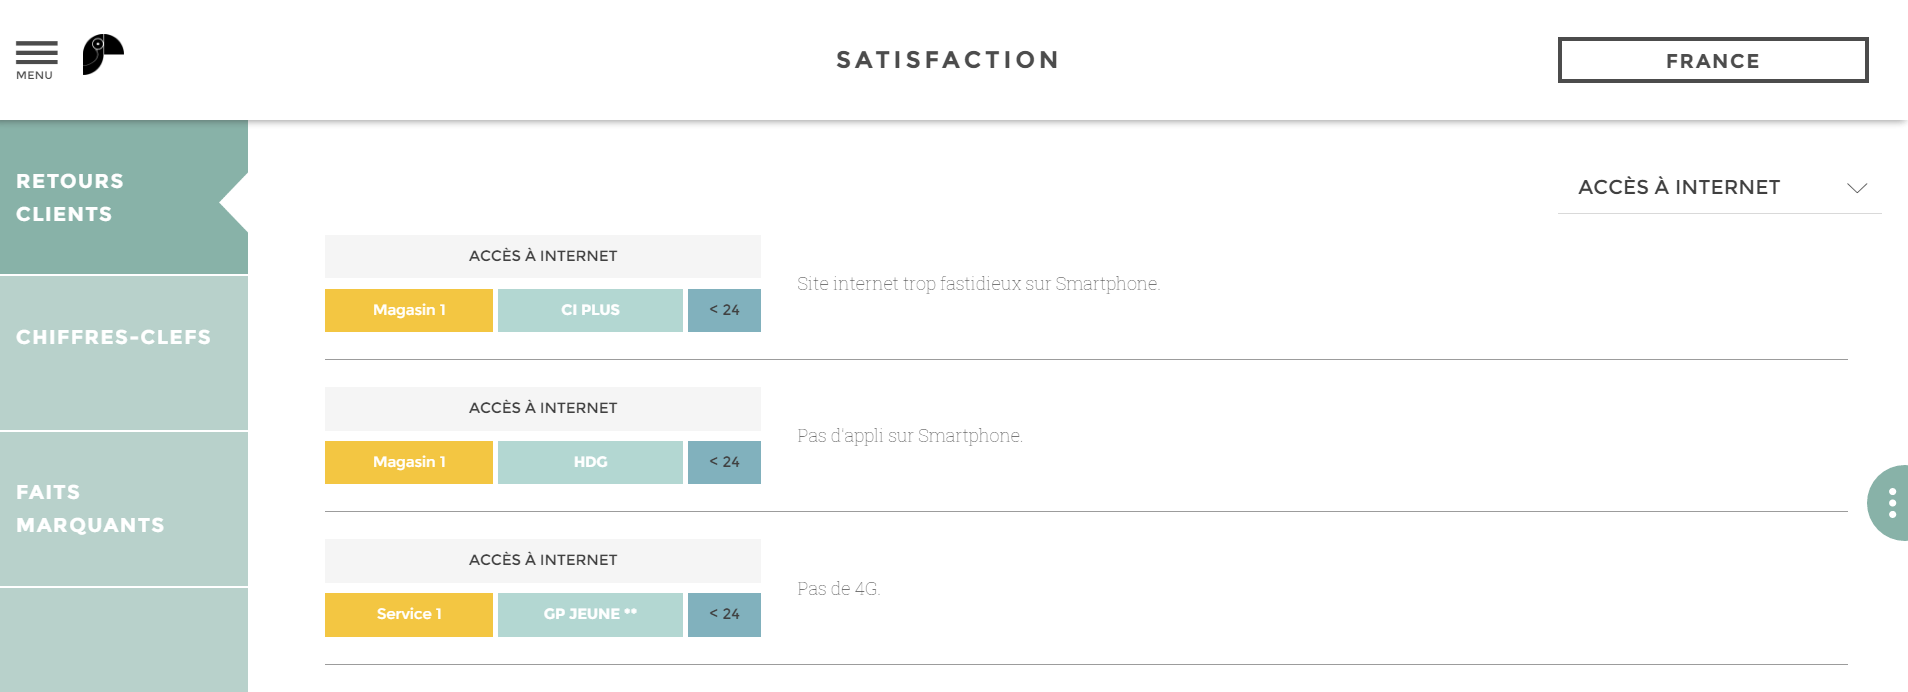
📝 For example, I want to see the customers reviews from a specific survey.
The verbatim is the best chart to retrieve text data such as clients reviews, comments etc… and to classify them into categories.
You can add up to 4 categories. You can mix different types of data : figures, texts, images. It can be a very complete chart ! Also, extremely good mobile lisibility.
Toucan USP
What makes this chart a killer story ?
Use images to illustrate your verbatim, tell a real story! 🖼️
I am a marketing analyst, and I want to know the content of Instagram post related to the products that my company sells. I can read the post in the verbatim and actually see the product thanks to the image.