How to :: create a PDF report
Overview
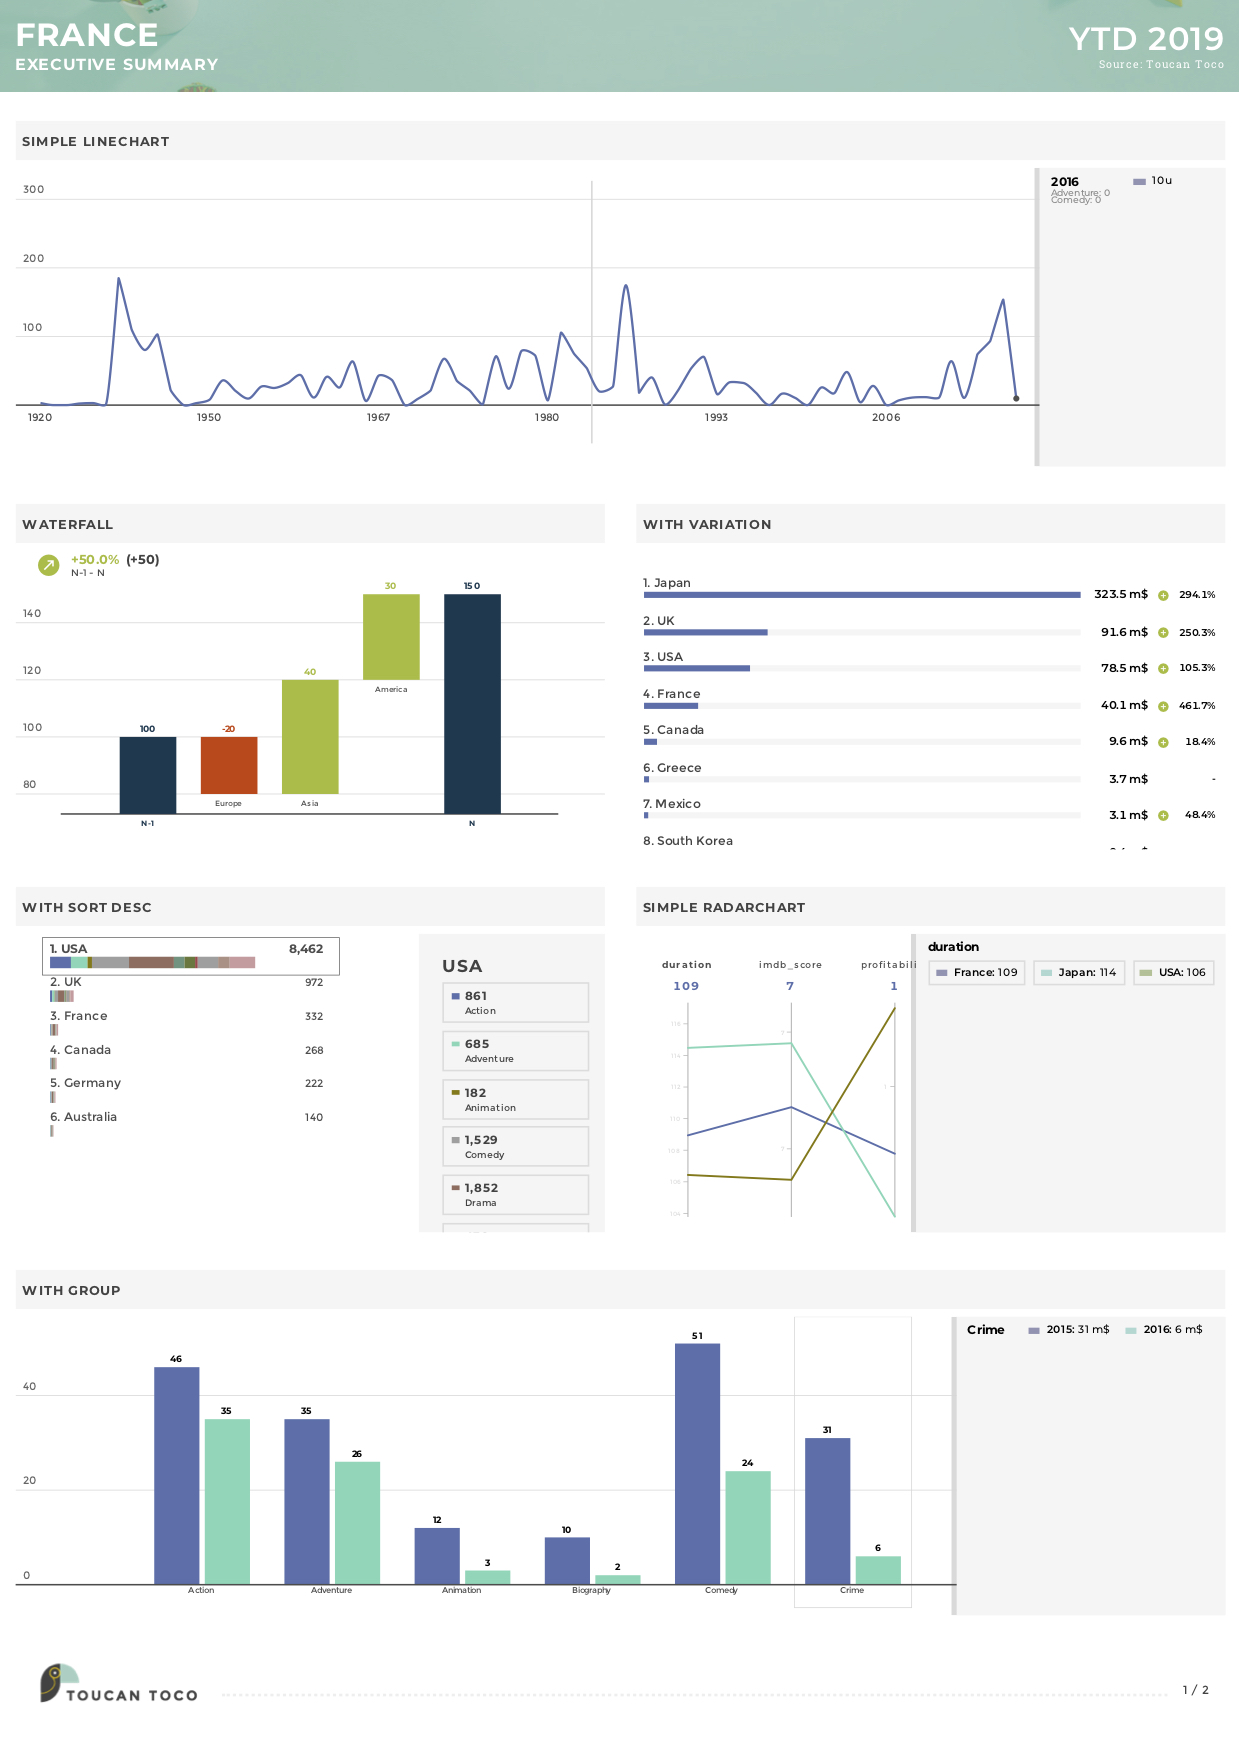
The PDF report is a static & printable summary of the application (in a A4 portrait format). As of today, an application can only have one PDF report.
With the Studio, you just have to select some stories or tiles from your application to create a clean pdf 🤩.
No need to think about the layout 📐, we take care of it for you.
The PDF report is available from the home action button for both end-users and app-builders.
The PDF report can be scheduled and sent to specific users groups on a regular basis. You can also share your PDF report in a MS Teams chanel or a Slack chanel. Amazing right ?
Some advice
Follow the placeholders in front of you to create a splendid PDF report in no time.
Below are some best practices, guidelines, cool tips to help you get the best of this crazy feature 💛 :
One rule! : Don’t forget to push to production your changes 🚨 !
Short is good : For a better user experience, we recommend not to exceed 4 rows. Remember it’s a PDF report, a summary, if your users need more, why not give access to the application? Oh and, less pages, more 🌳
Paper is not dynamic : Keep in mind that stories with filters/requesters won’t be usable on paper 🤔, so make sure to select a filter/requester value when you choose a filtered story. By default, default filters/requesters values will be used. ⚠️ For crossfilter stories or double chart stories, only the primary chart will be displayed.
Put a name on it : Pages can me named, so use it to make your layout clear. It won’t be seen anywhere, it’s just here to help you as an app-builder 😉.
Take a look at me : Before sending or pushing to production, always take a look at what you created 🤳. With the preview button, it’s easy as “abc” 🕺 to ensure your PDF report is correct. And you can even preview the PDF report with different permissions and visibility settings.
Context is key : Add text zones or section titles to add even more context to the data you’re sharing
Warning
Disclaimer : Collaboration is not possible on the PDF report. App builders can update the PDF report only one at a time.
Things to keep in mind
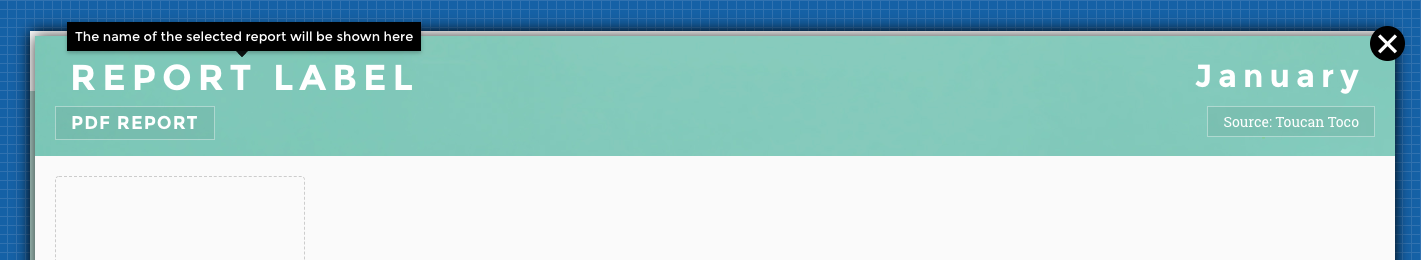
By default, the PDF report is generated with the viewer’s point of view. Meaning, the viewer report and date selection will be used in the PDF report. But also visibility and permission settings will be applied. If a story or a tile in the PDF report is not visible by the sender, it won’t appear in the PDF report.
The header is configured by default as follow,
- if a date requester is configured in the application, it will appear on the right side of the header 📅
- the application title will be shown in the header, unless a report is configured. If a report selector is setup, the report name will appear in the header.
Only the first two highlighted KPIs will be displayed in the story’s title. They will be displayed by default.
Rows can only contain tiles or stories, but not a mixed of both at the moment.
Advanced story configurations
The PDF report is reusing existing charts with the ability to override some options in order to better customized your pdf.
You can switch to code mode to update some of your chart’s configuration. Templating is accepted 🔥
Note
Use this carefully, the PDF report is supposed to be a snapshot of the application. You should not be recreating charts here.
Add your overrides inside the following block to start updating your chart’s configuration.
overrides: {}
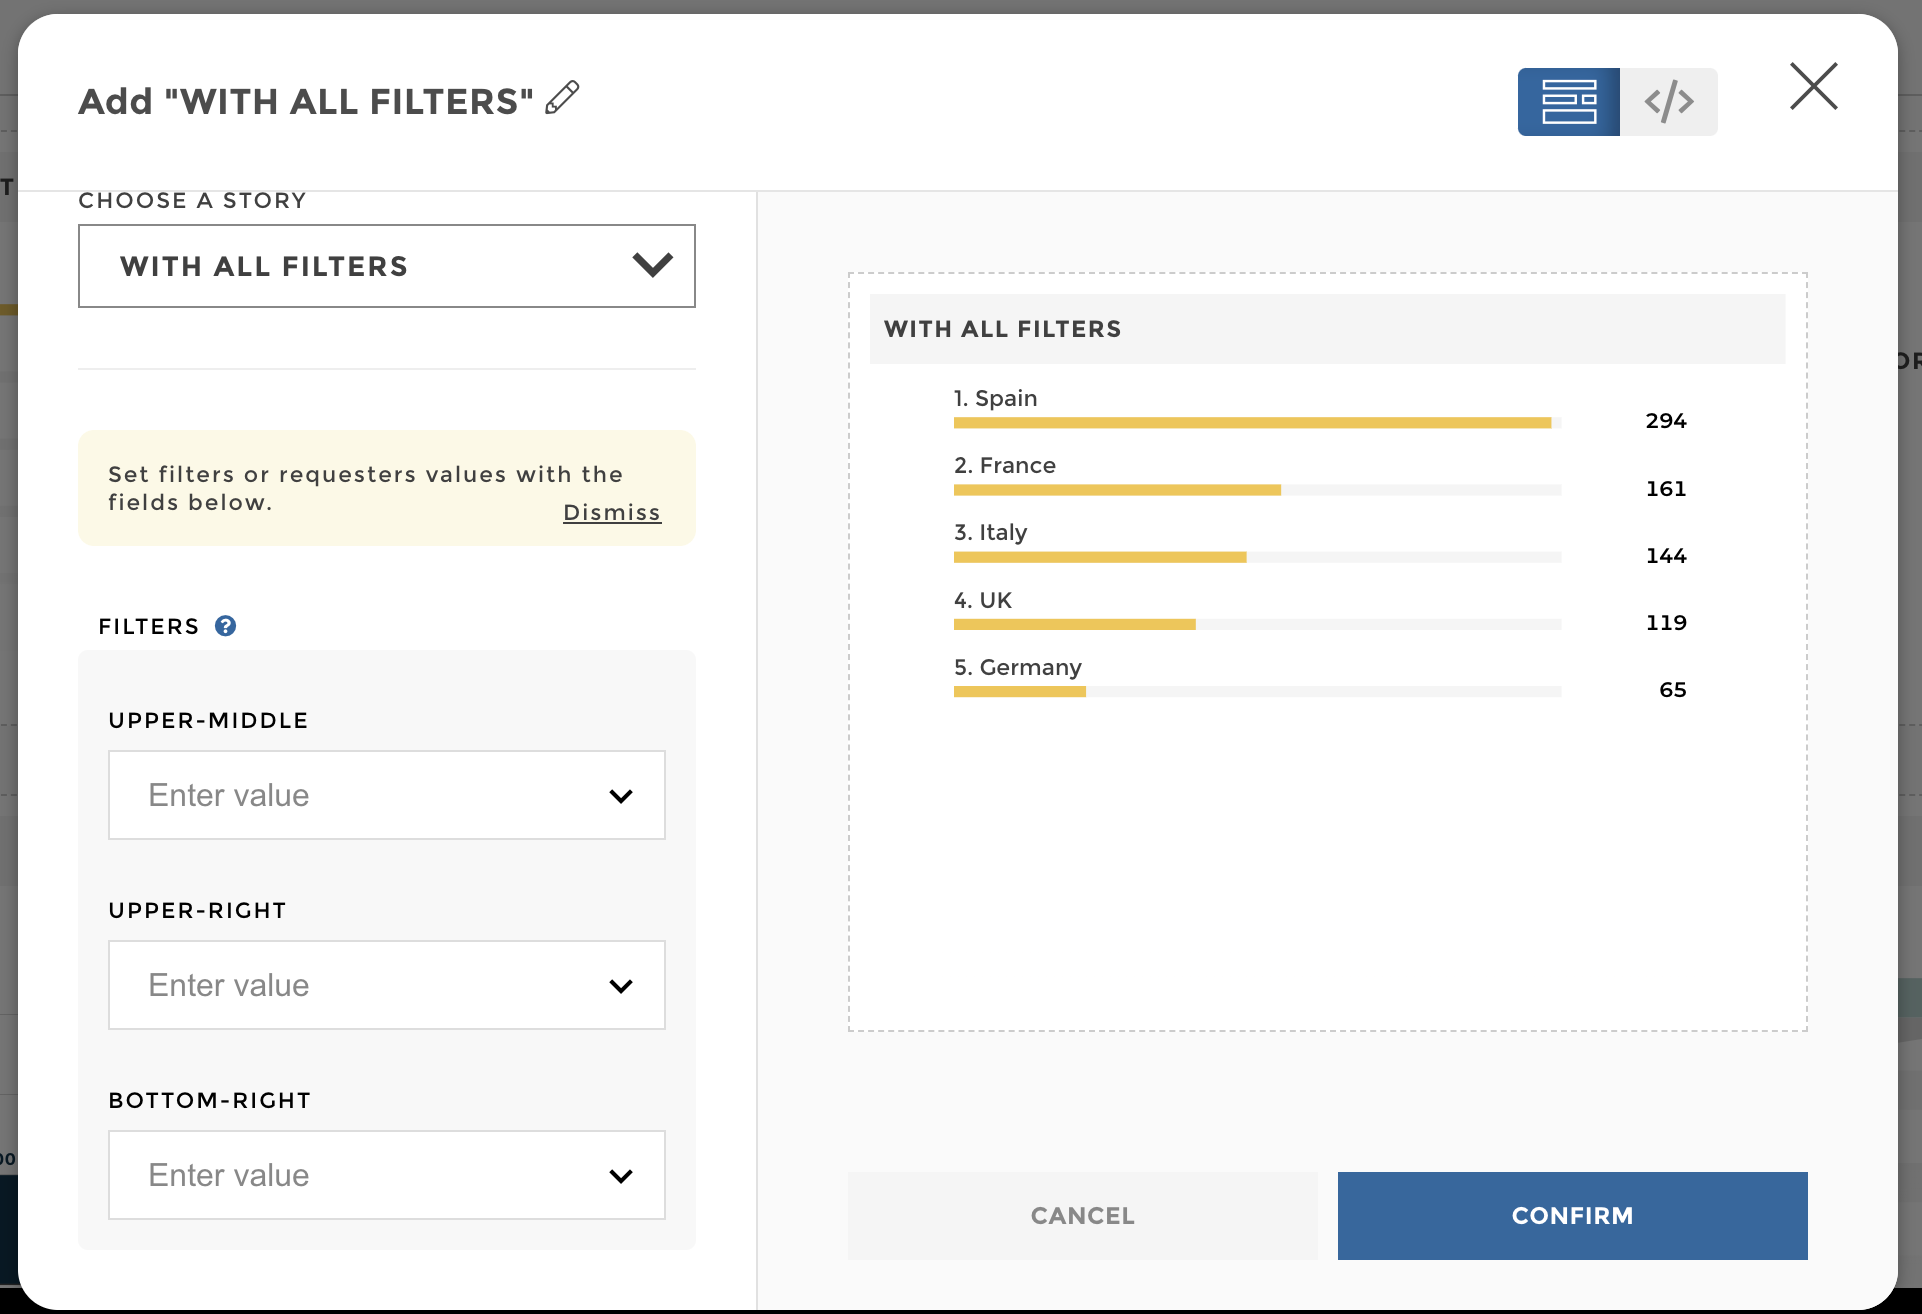
filters
You can set filters in stories to show a specific value when the PDF report is generated. By default, the first value will be selected. Please note that for checkbox filters, all values are shown by default.
overrides:
  charts: [
    {
      filters:
        "upper-right":
          default : "value selected"
        "upper-middle": #if crossfilter
          default :
           type: "include"
           values: [
            "value_1"
            "value_2"
           ]
    }
  ]
filters:
  "bottom-right":
      default : "value selected"
Please refer to filters’ default advanced configuration if needed.
⚠️ first and last selections are not available for sliders
filters.
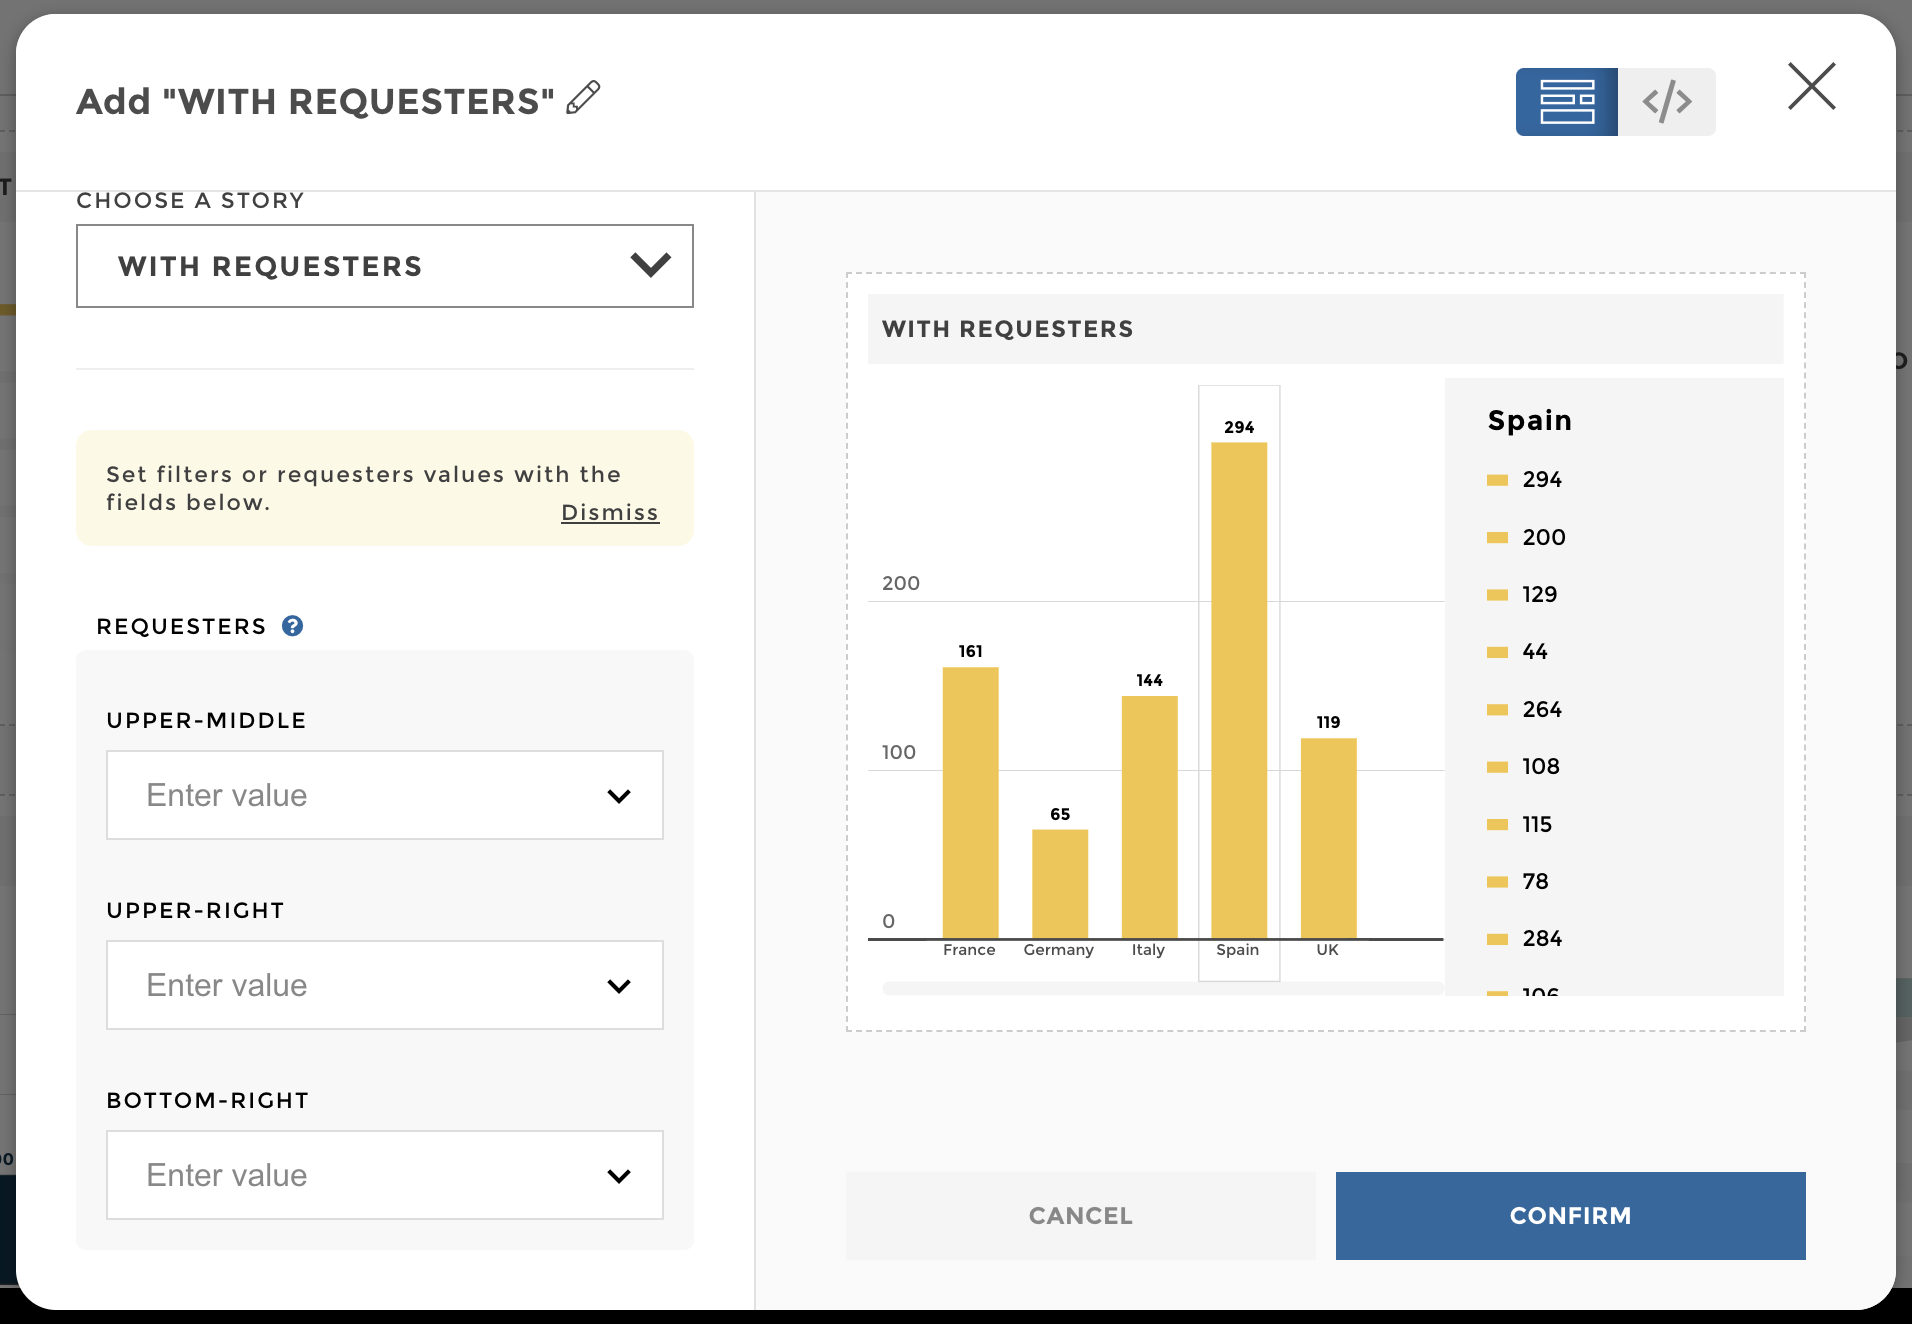
requesters
You can set requesters in stories to show a specific value when the PDF report is generated. By default, the first value will be selected.
overrides:
  charts: [
    {
      requesters:
        "upper-right":
          default : "value selected"
        "upper-middle":
          default : "value selected"
    }
  ]
requesters:
  "bottom-right":
      default : "value selected"
It won’t be possible to fix different value to a requester with the same id. If stories are using the same requesters, with the same id, the selected requester value will be fixed for all of these stories. If you’d like to use twice the same story and setting the requester on different values, we suggest that you create a copy of the story and change the requester id to do so. You can then hide the copied story from production.
You can set the legend to show a specific value when the PDF report is generated. By default, the first value will be selected.
overrides:
  charts: [
    {
      defaultSelected: 'Label to select'
    }
  ]
This is available only for the following charts :
- barchart
- barlinechart
- bubblechart
- mapchart (new)
- radarchart
- stackedbarchart
You can override report’s visibilities to change who can see the stories in the PDF report.
overrides:
  visibility:
    mode: "report"
    allowedEntries: [
      {
        Label: [
          "my_label"
        ]
      }
    ]
Let say you created stories just for the PDF report. These stories are hidden in production, so by default they won’t show in the PDF report. Unless you override it.
overrides:
  visibility: true
Advanced header configuration
You can overwrite the default behavior of the PDF report header.
You can do so from the Files interface, while editing the
front_config file.
Add the following fields inside the execsumConfig: block. It will
overwrite the existing title or date.
execsumConfig:
  customTitle : "My new title"
  customDate : "My new date"
It’s kind of an advanced move, make sure you know what you’re doing, otherwise reach out to our lovely care team.
Complete PDF report
From the PDF report toolbar you can access the advanced mode. The advanced mode allows you to create a complete PDF report.
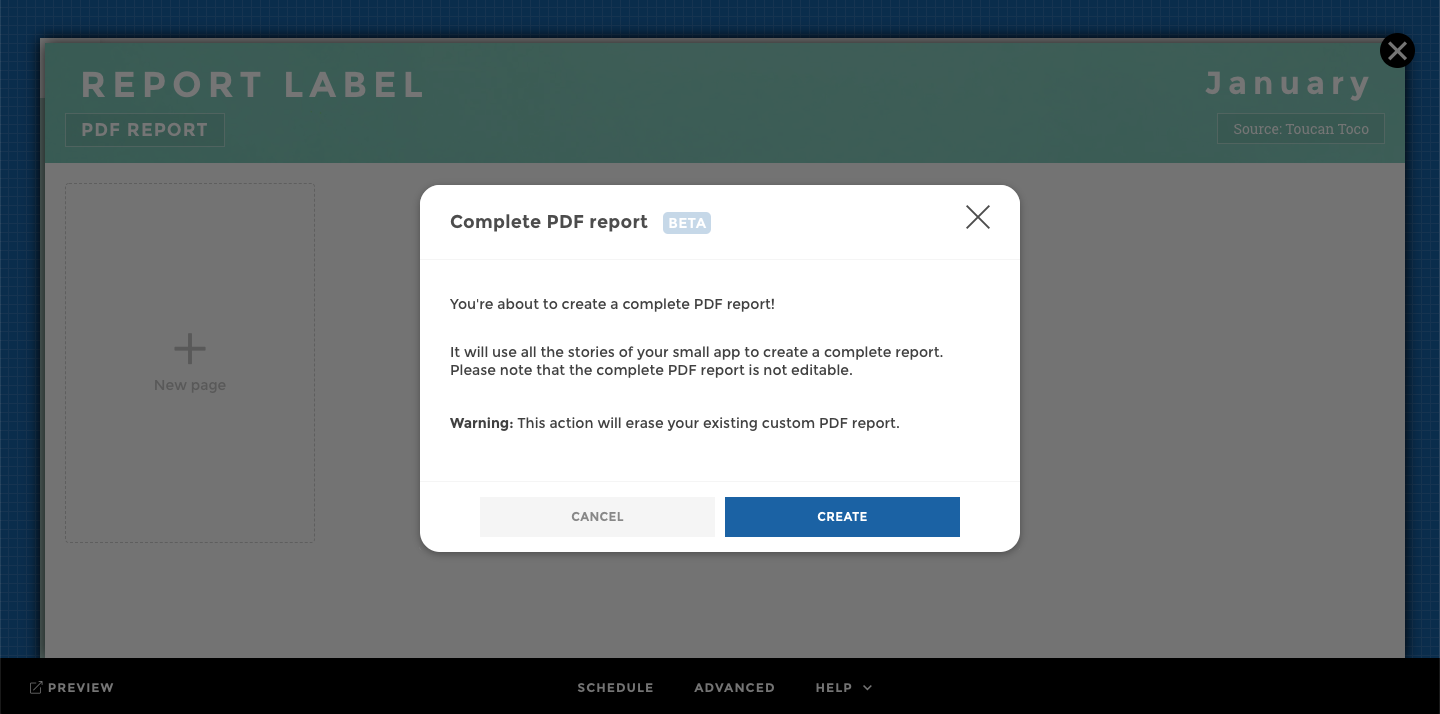
This complete PDF report will automatically generate a PDF with all the stories (and stories only) of your application :
- Chapters will start on a new page, and the chapter names will be visible on the header
- Subchapters will appear in the pages, and subchapter names will be visible in a gray line
- A table of content can be added to the complete PDF report, but is not editable
- Page of a complete PDF report are not editable. You can’t modify stories order or delete a story from a page
- New stories will automatically be added to your complete PDF report
- Crossfilter stories will be added to the complete PDF report using only the Primary chart
- Filters/requesters will be set on the default defined value in the story
- Only stories with filers/requesters will be editable in order to define another filter/requester value and update the story title’s accordingly if necessary