How to :: create a datawall
Overview
We want to enable you to bring insights through data, so we created a datawall to showcase dynamic reports on a TV screen, or on a digital wall. Let’s bring the information to everyone in your company.
The datawall displays, during a defined time (configurable), several pages with chosen stories and tiles.
The usage is quite different from the application : you are having a break, and in the cafeteria there is a TV screen displaying the performance of the acquisition team.
With the Studio, you just have to select some stories or tiles from your application to create a clean datawall 🤩.
No need to think about the layout 📐, we take care of it for you.
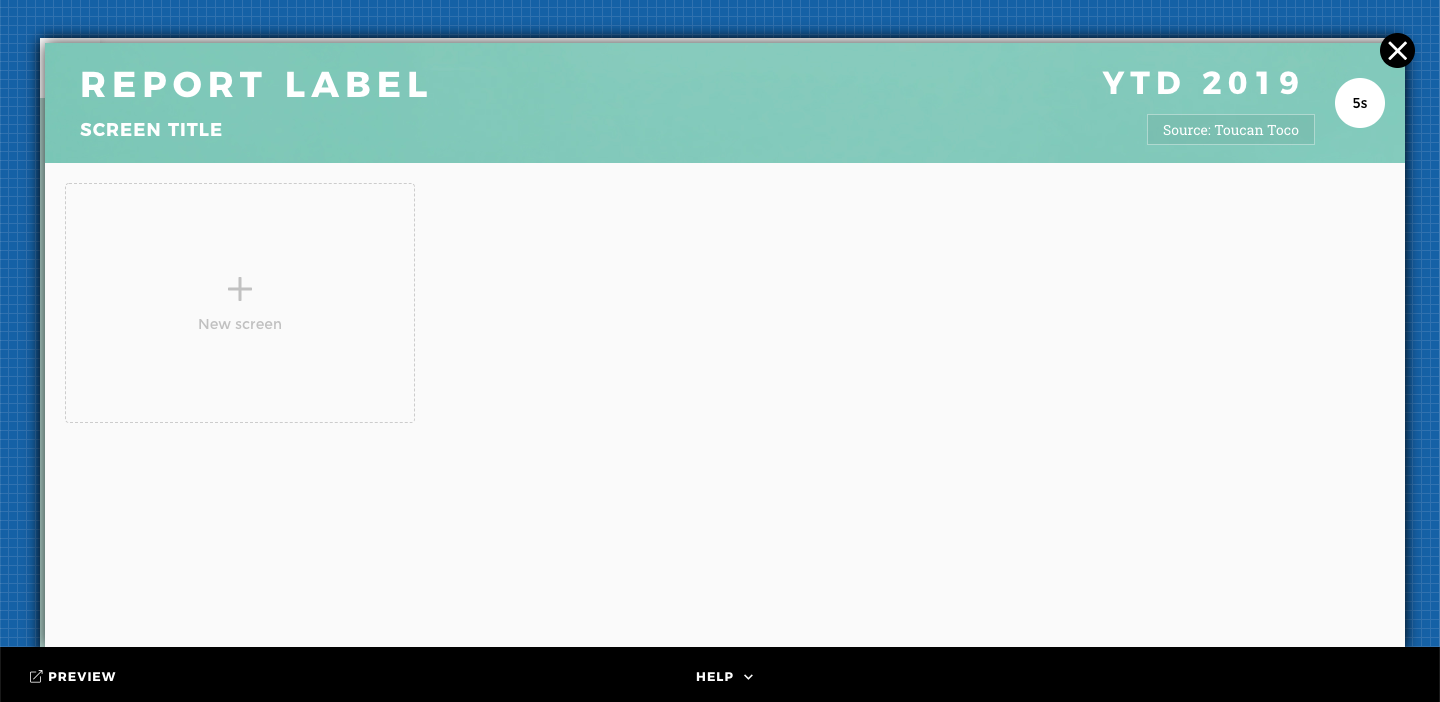
The Datawall is available from the home action button for both end-user and app-builders.
Some advice
Follow the placeholders in front of you to create a splendid datawall in no time.
Below are some best practices, guidelines, cool tips to help you get the best of this crazy feature 💛 :
One rule! : Don’t forget to push to production your changes 🚨 ! You can preview the production version by removing the ``&stage=staging`` from the url in the preview mode.
Short is good : For a better user experience, we recommend not to exceed 3 rows. Remember it’s a datawall, if your users need more, why not give access to the application?
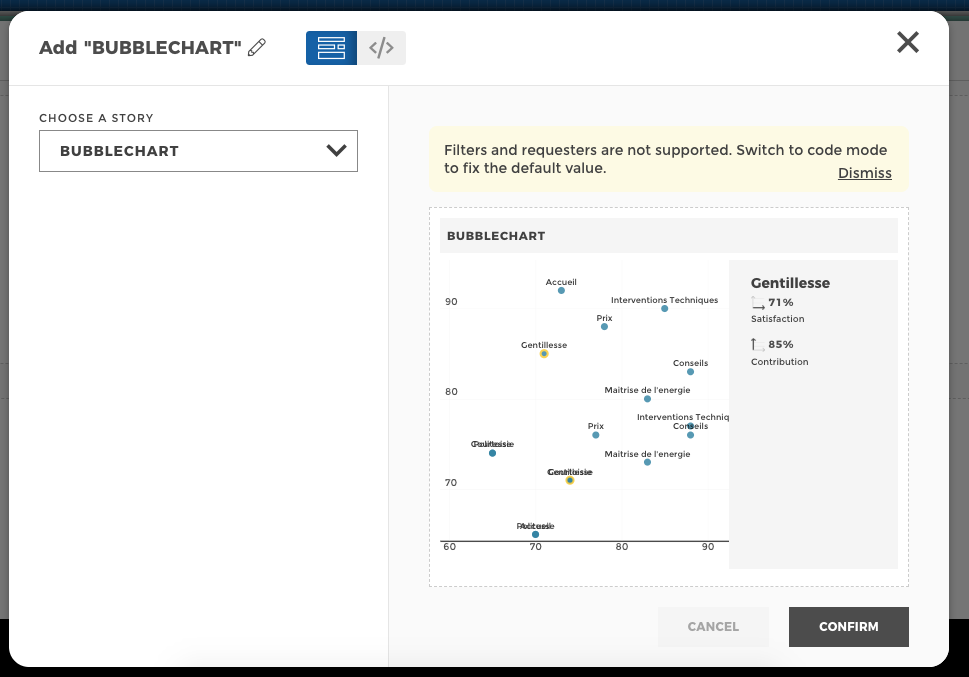
Screens are not necessarily tactile : Keep in mind that stories with filters/requesters won’t be usable in the datawall. Imagine having someone standing next to each digital wall you have and pressing on the filters buttons every 15 seconds… 🤔. Make sure to select a filter/requester value when you choose a filtered story. By default, default filters/requesters values will be used. ⚠️ For crossfilter stories or double chart stories, only the primary chart will be displayed.
Put a name on it : Screens can me named, so use it to make your add even more context to your awesome datawall 😉.
Take a look at me : Before showing your datawall or pushing to production, always take a look at what you created 🤳. With the preview button, it’s easy as “abc” 🕺 to ensure your datawall is correct.
Things to keep in mind
By default, the datawall is generated with the viewer’s point of view. Meaning, the viewer’s report and date selection will be used in the datawall.
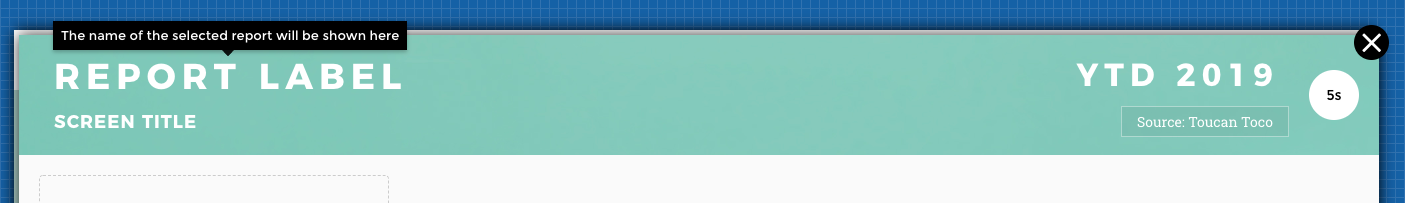
The header is configured by default as follow,
- if a date requester is configured in the application, it will appear on the right side of the header 📅
- the application title will be shown in the header, unless a report is configured. If a report selector is setup, the report name will appear in the header
- screen’s title will be shown in the header
- by default, screen will appear 5 seconds before moving on to the next one, feel free to change the timer’s setting directly from the header
Only the first two highlighted KPIs will be displayed in the story title. They will be displayed by default.
Rows can only contain tiles or stories, but not a mixed of both at the moment.
Code mode configuration
The datawall is reusing existing stories or tiles with the ability to override some options in order to better customized your display.
You can switch to code mode to update some of your chart’s configuration. Templating is accepted 🔥
Note
Use this carefully, the datawall is supposed to be a snapshot of the application. You should not be recreating charts here.
Add your overrides inside the following block to start updating your chart’s configuration.
overrides: {}
filters
You can fix filters in stories to show a specific value when the datawall is generated. Please note that for checkbox filters, all values are shown by default.
overrides:
  charts: [
    {
      filters:
        "upper-right":
          default : "value selected"
        "upper-middle":
          default : "value selected"
    }
  ]
filters:
  "bottom-right":
      default : "value selected"
Please refer to filters’ default advanced configuration if needed.
⚠️ first and last selections are not available for sliders
filters.
requesters
You can fix requesters in stories to show a specific value when the datawall is generated.
overrides:
  charts: [
    {
      requesters:
        "upper-right":
          default : "value selected"
        "upper-middle":
          default : "value selected"
    }
  ]
requesters:
  "bottom-right":
      default : "value selected"
It won’t be possible to fix different value to a requester with the same id. If stories are using the same requesters, with the same id, the selected requester value will be fixed for all of these stories.
You can fix the legend to show a specific value when the datawall is generated. By default, the first value will be selected.
overrides:
  charts: [
    {
      defaultSelected: 'Label to select'
    }
  ]
This is available only for the following charts :
- barchart
- barlinechart
- bubblechart
- mapchart (new)
- radarchart
- stackedbarchart
Advanced header configuration
You can overwrite the default behavior of the datawall header.
You can do so from the Files interface, while editing the
front_config file.
Add the following fields inside the dataWall block. It will overwrite the existing title or date.
dataWall:
  customTitle : "My new title"
  customDate : "My new date"