Geography
Add geographical zones to your data
Geographical datasets are datasets in which each row contains the coordinates of a zone that can be displayed on a map.
Geographical data
Geographical coordinates are like data, except they reside not in CSV or excels, but in other file types like GeoJSON, Shapefiles, etc. You can experiment with these files in online tools like GeoJSON.io and Mapshaper.
A typical GeoJSON describing zones consists in an array of “Features”, called a “FeatureCollection”. Each feature has:
- a
geometrywhich contains the list of coordinates necessary to draw the zone, - a set of
propertiesdescribing the zone, a bit like a data row.
The properties will be essential to be able to associate the zone with the corresponding data.
If we draw the well-know hexagon of France in
GeoJSON.io, we can observe the corresponding
JSON on the right: 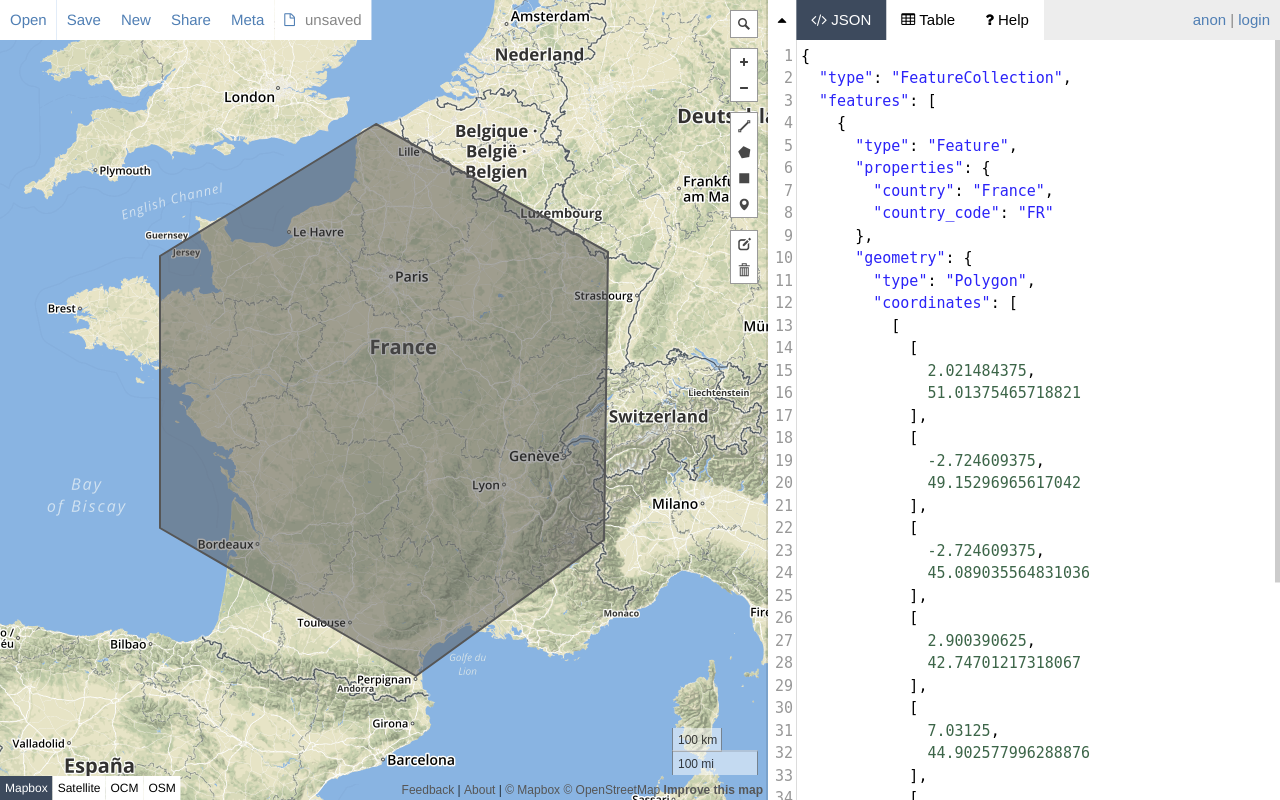
Here is a very simplified view of large western European countries
created in this tool, as an example. Note the table view which makes it
easy to see the properties without scrolling through a long JSON
full of coordinates. 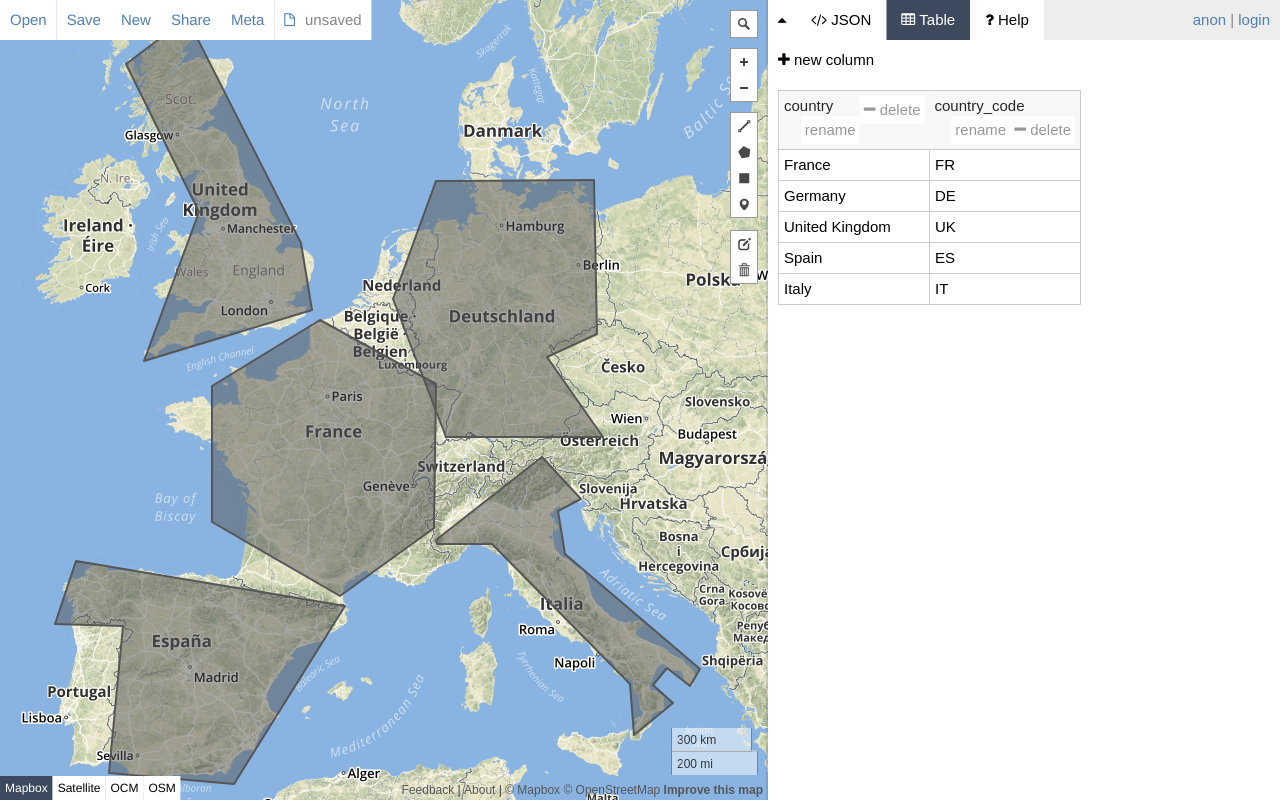
Note
In this doc, we’ll use indifferently “zones” or “(geographical) features” (often abbreviated “geofeatures”).
Import geographical zones into your small app
Files like GeoJSON generally contain many zones, forming what we call a “mesh”.
These files can be imported in the “Data sources” interface, within the
“Update Basemap” section. 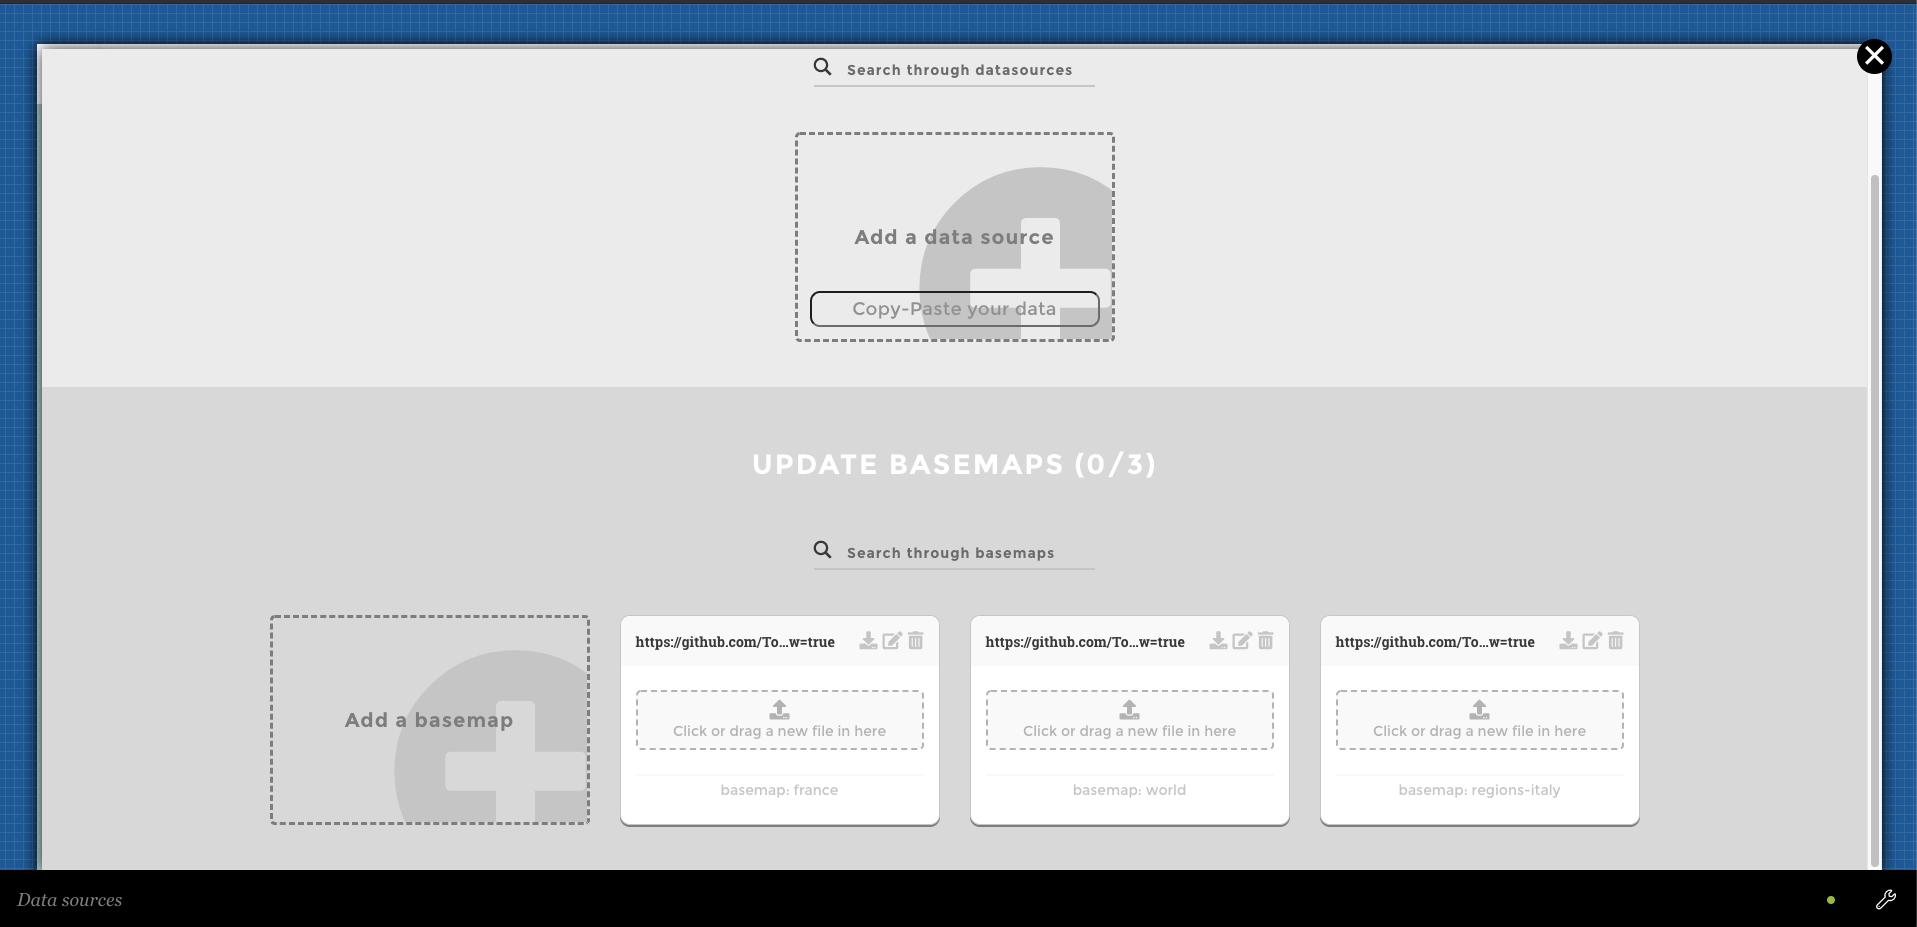
Let’s add a new mesh by hitting “Add basemap”. It has 2 main properties:
meshis the name of the file (correspond to thefileattribute for data sources)basemapis the id of this mesh, to differentiate it from potential others (equivalent to thedomainattribute for data sources)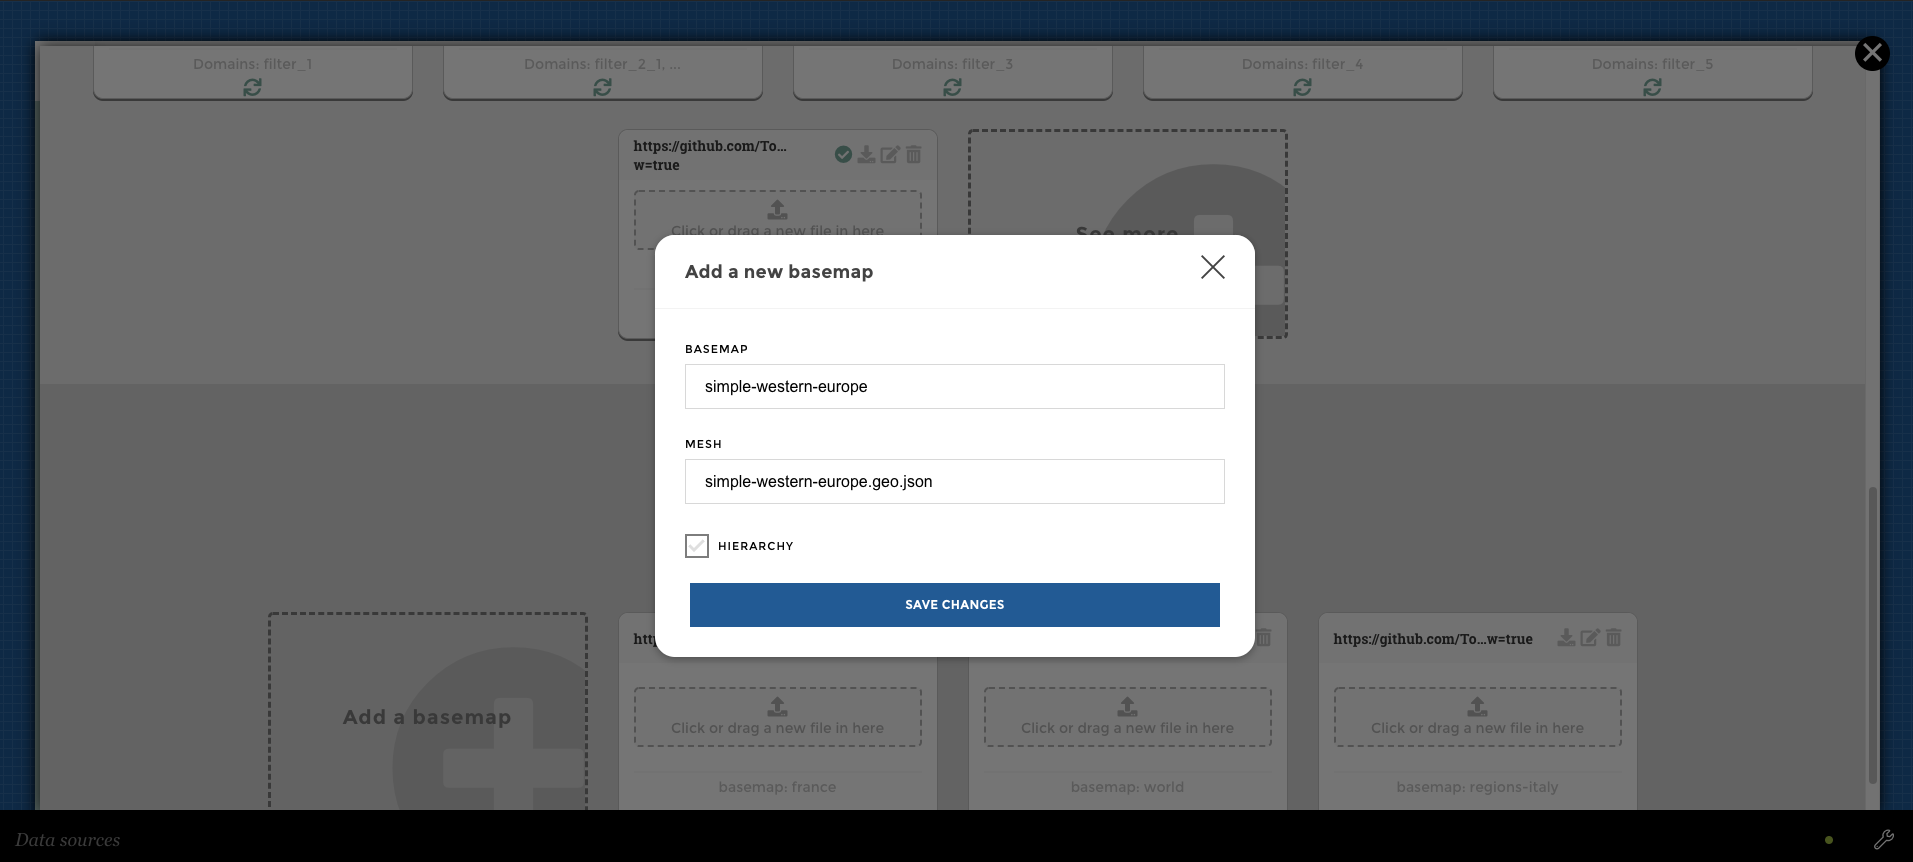
From there, we can drop our GeoJSON file in the newly created block, and
make the app read it and save it by starting the “Load basemaps”.
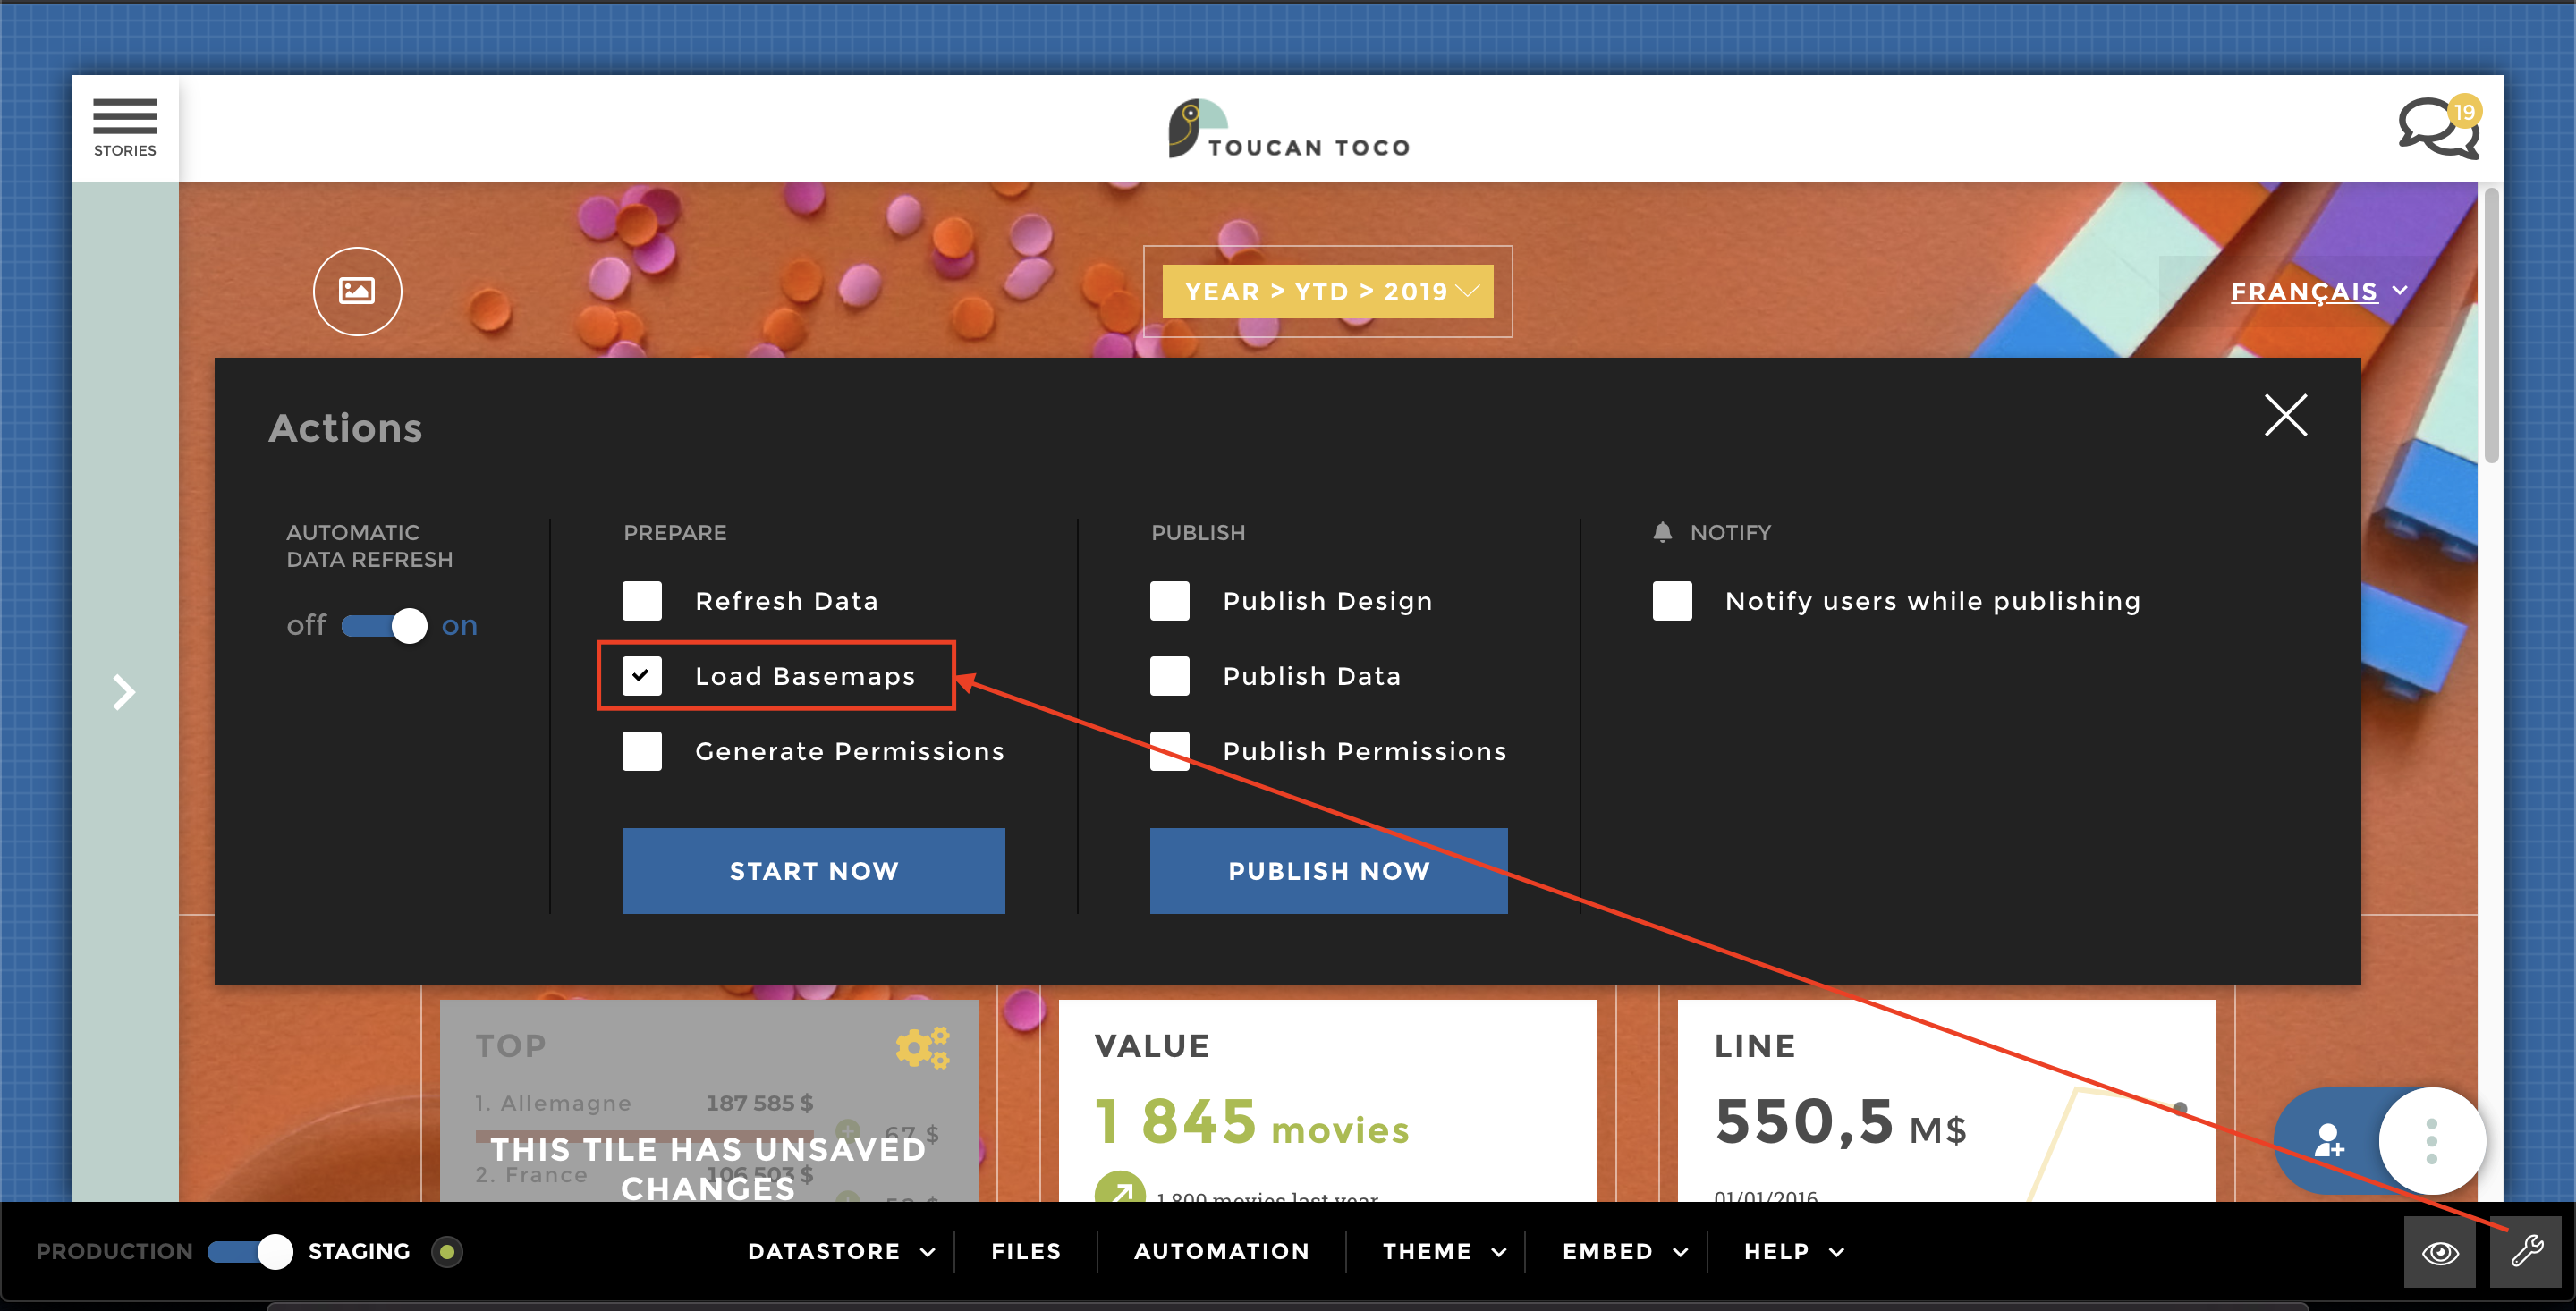 During this, the server reads the file and insert
each zone in the database so we can use them later. It also add the
During this, the server reads the file and insert
each zone in the database so we can use them later. It also add the
basemap value to the properties of each zone of the mesh.
Note
Each time you drop a new mesh or modify the configuration of one, don’t forget to update the zones database by launching “Populate basemaps”.
Join geographical zones to data rows
Now that we have geographical zones available in our database, it’s time to join them with a dataset.
Given the previously hand-drawn zones and this data:
| code | GDP |
|---|---|
| FR | 2.583 |
| UK | 2.622 |
| DE | 3.677 |
| IT | 1.935 |
| ES | 1.311 |
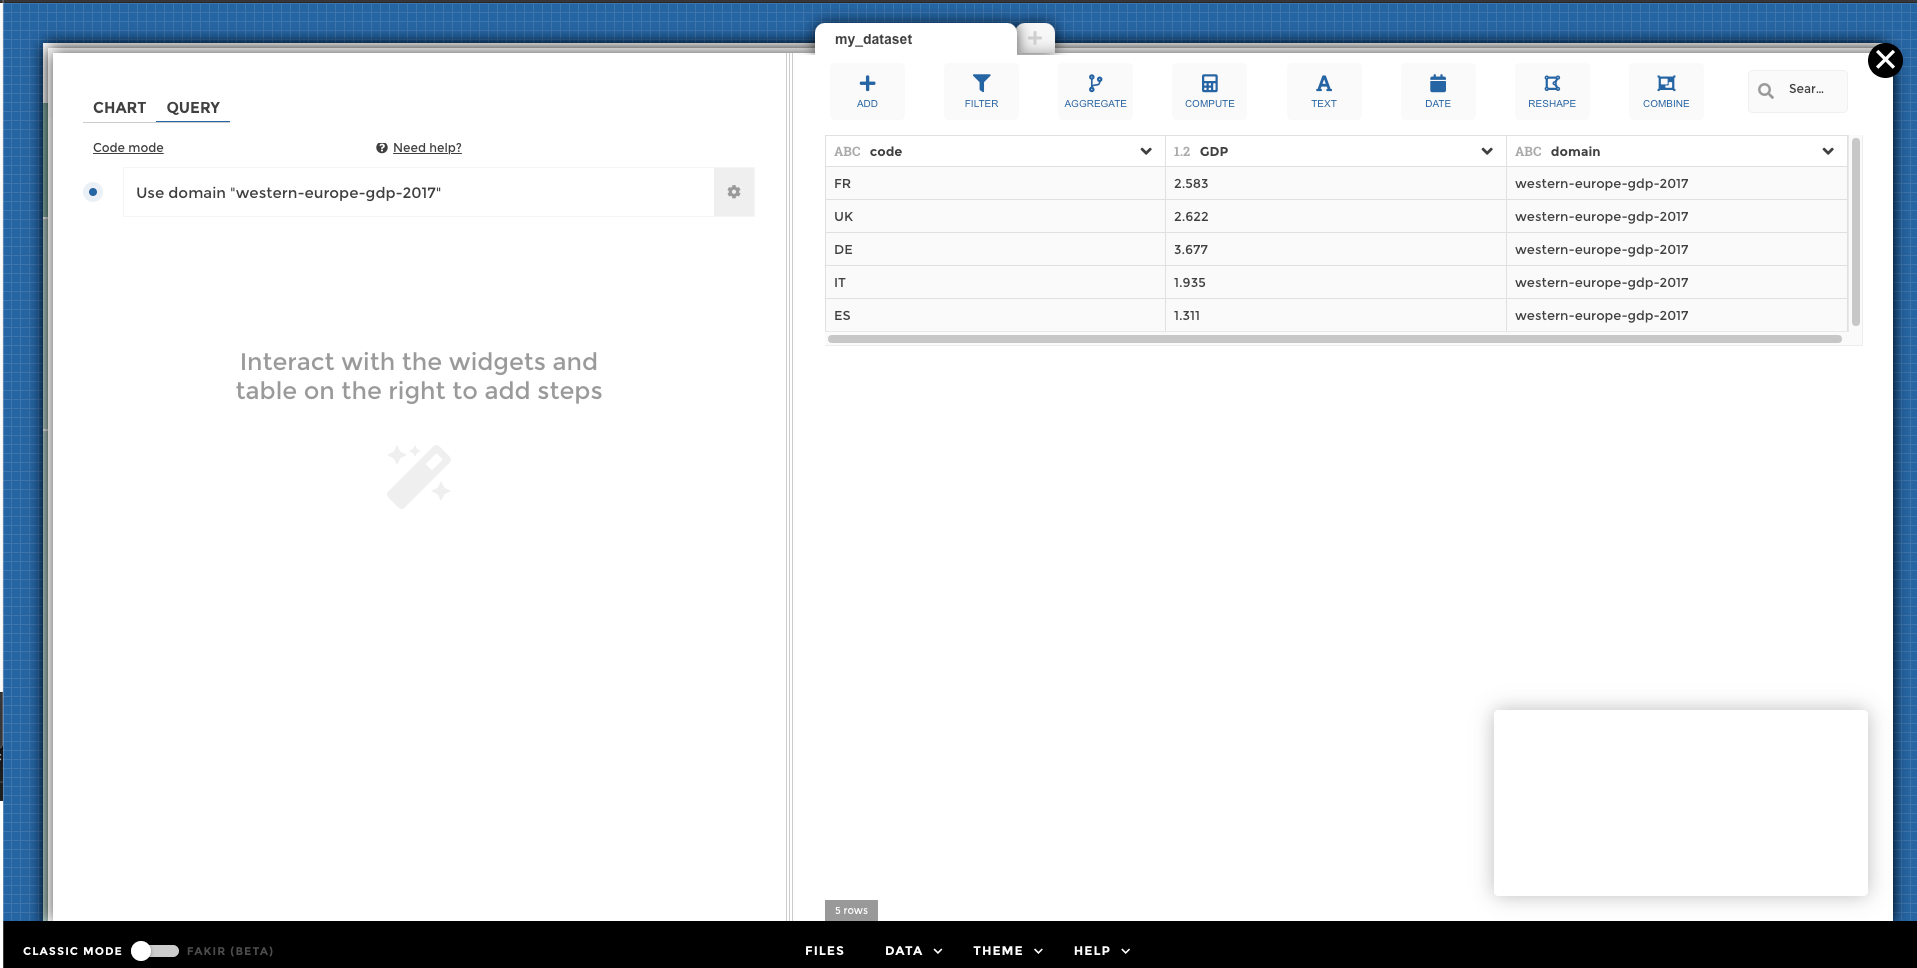
Sample countries data
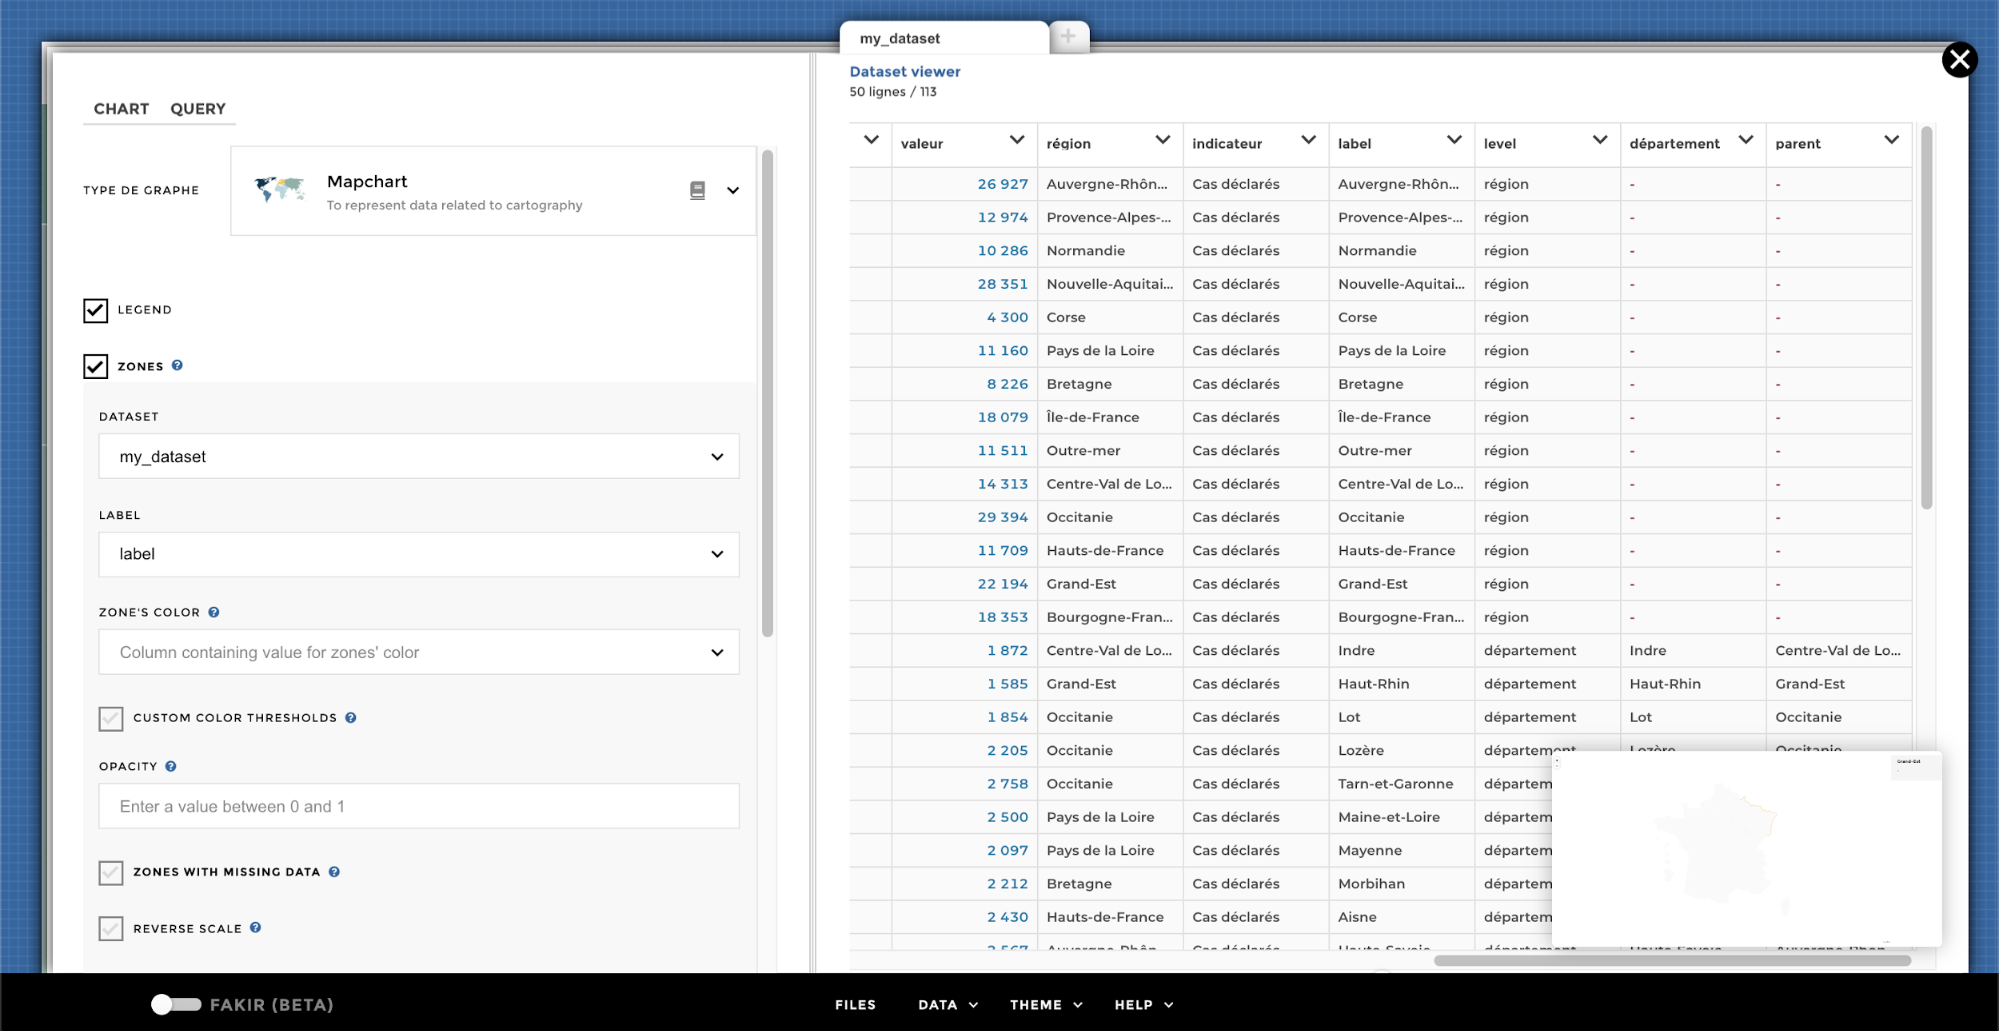
We can join the two using the mapchart form in
Zones > Color zones > Basemap section :
Dataset columnspecifies the column from the dataset that will be used to match with basemap zonesBasemap columnspecifies the column from the basemap
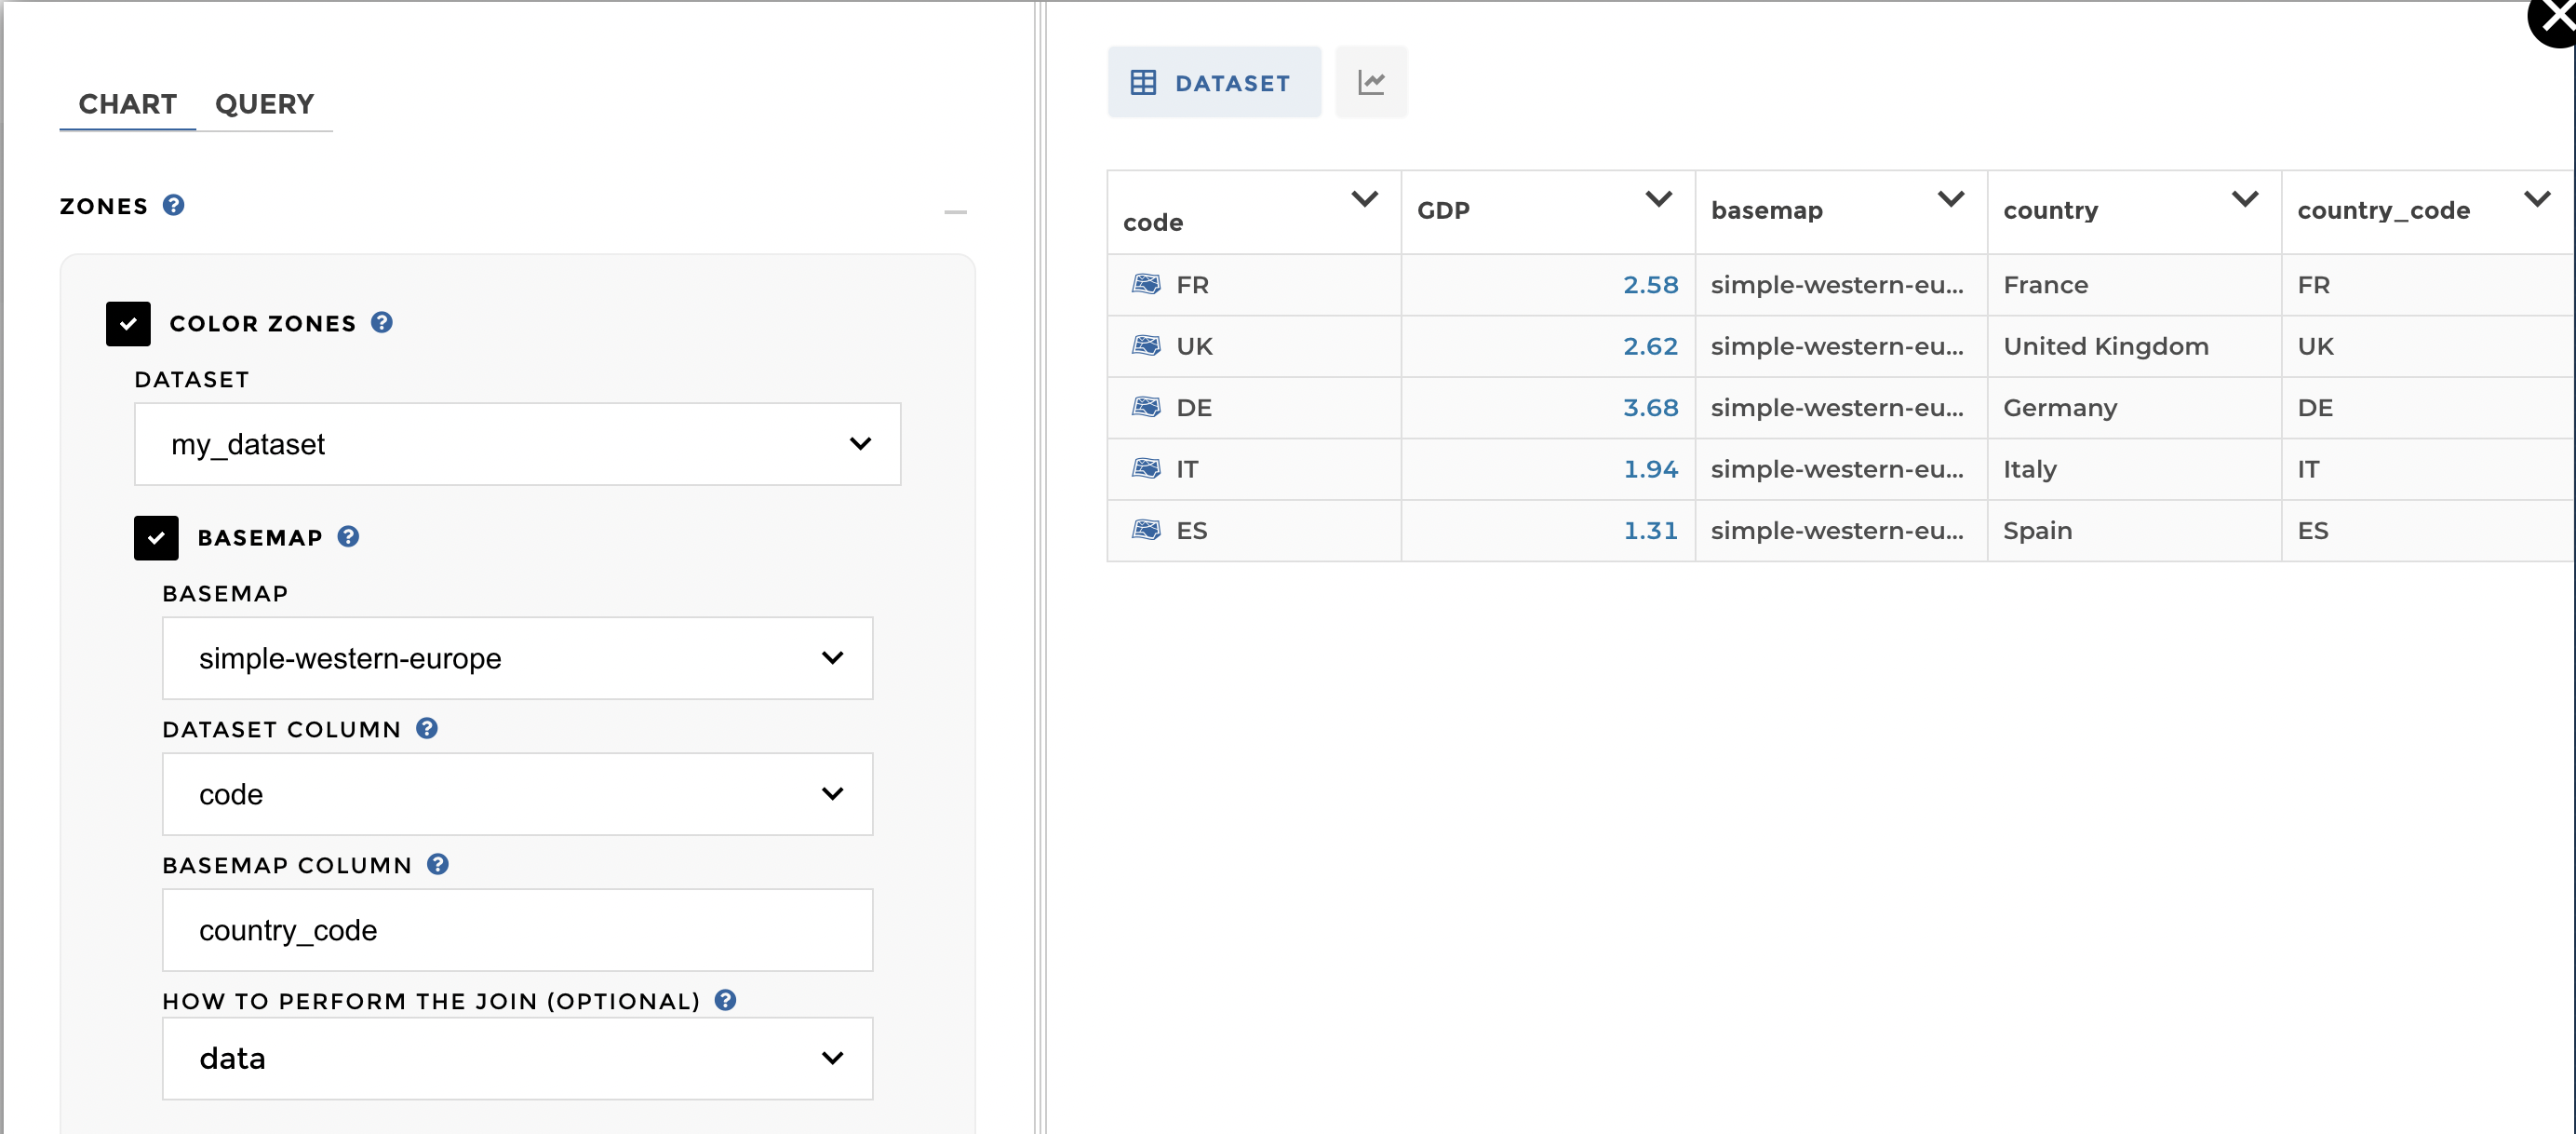
Geofeatures configuration
All zones properties are made available in the dataset as columns.
Note
Note the blue map icon that appears next to every row that contains a zone. Clicking on this icon opens the zone in GeoJSON.io.
Advanced joins
Different joins are available, which can be specified in the join
property:
how: "data"(default) keeps data rows even if no features matches, and discard features which have no matching data rowhow: "features"keeps features even if no data row matches, and discard data rows which have no matching featurehow: "outer"keeps every feature and data rowhow: "inner"discards every feature or data row that haven’t matched together
Tip
While you prepare your dataset, it’s a good idea to use "outer", so
if the join fails, you’ll be able to see why by exploring both columns
of data and features.
Geographical datasets with hierarchy
As described in the previous section, it’s possible to express parent/child relationship between data rows.
Note
To build a drill mapchart you will need two elements :
- One basemap containing the parent and the children value
- And a dataset that could be transformed into a hierarchical one.
Step 1: Let’s start with the Basemaps:
When working on a json basemap, it’s good to keep in mind that you could use https://geojson.io/ to check your basemap file and understand its structure. In the following example we are going to use a France.json basemap. This file contains all the departments and the region which they are part of. This Region column will allow us to build the hierarchy for the basemap.
Note
It’s highly common to have in your basemap only the lower-level features. Nevertheless, you may need to have higher-level zones to associate data with.
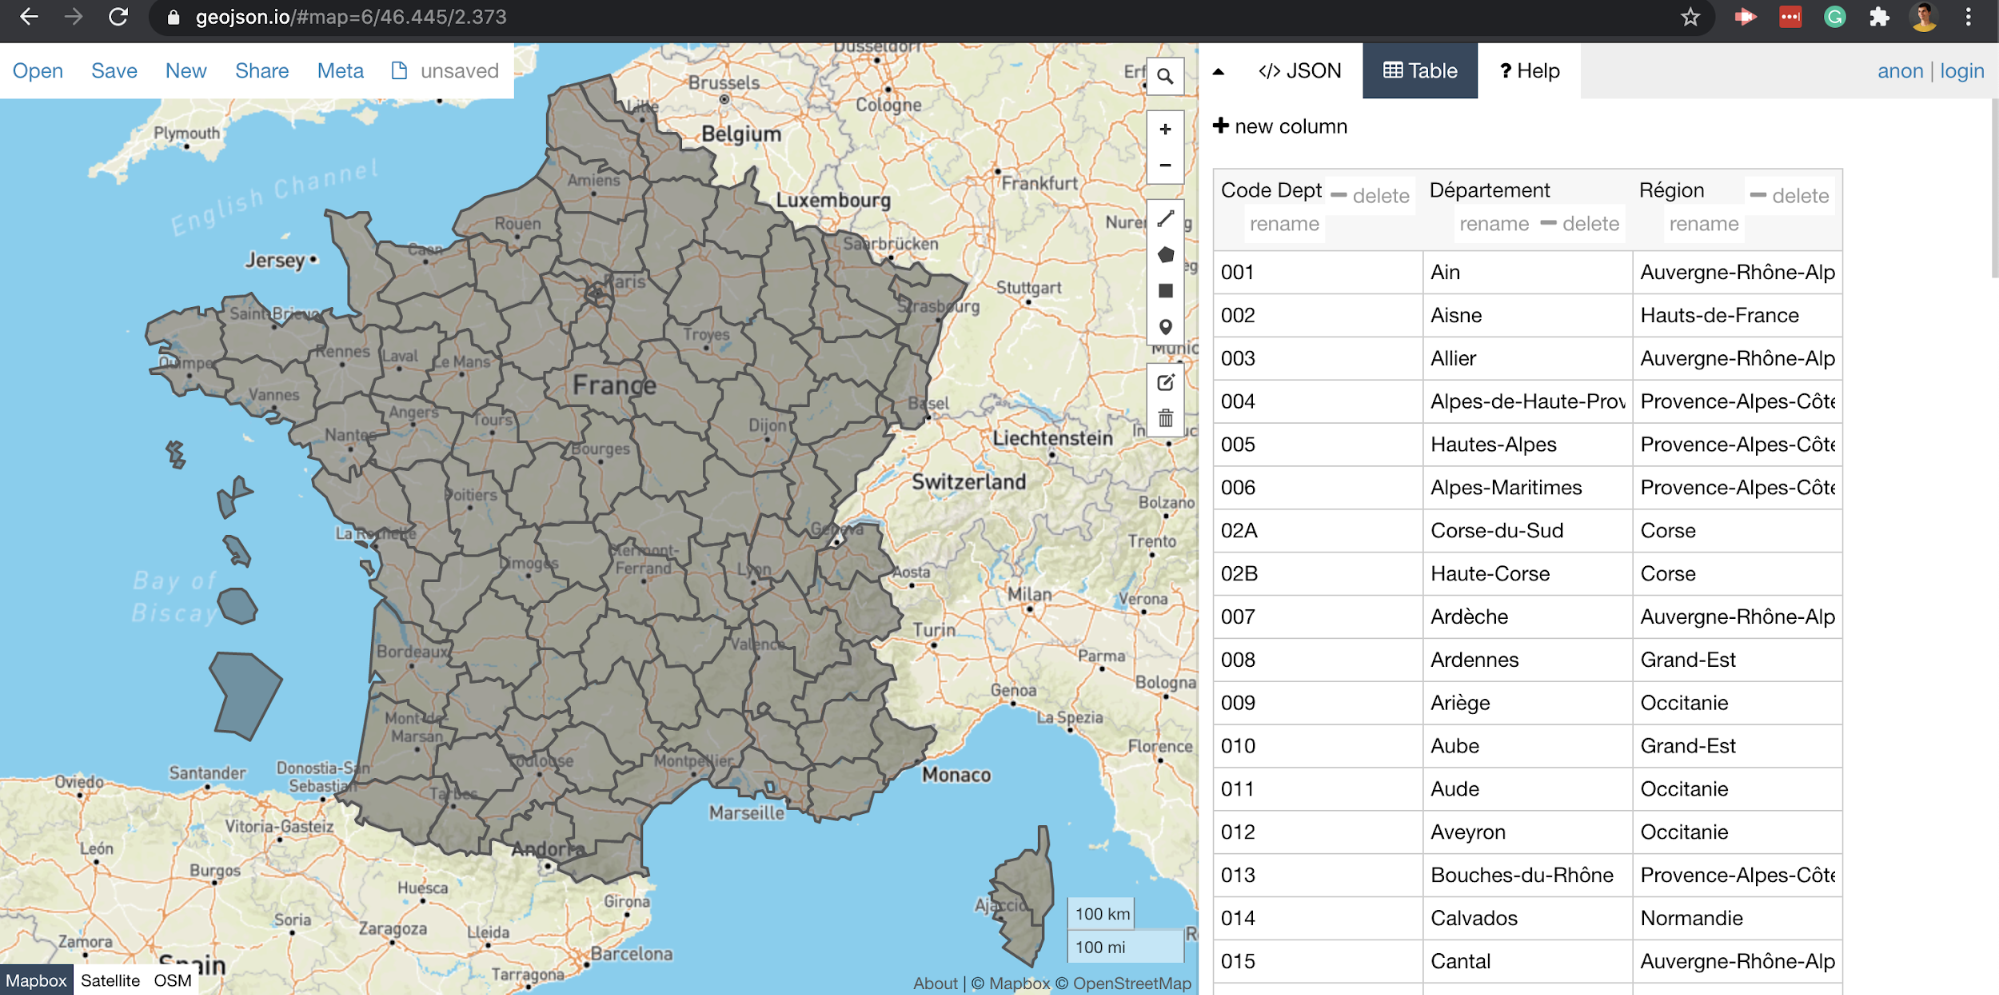
basemap geojson
Now you can go in the Data source part of Toucan and drop your basemap. In the following form:
- Basemap : will be the name of your basemap (the on used in your story with the geofeatures)
- Mesh : needs to match exactly the name of the file you’re dropping. To build the drill mapchart, we need to add a hierarchy into your basemap.
- The column ‘Région’ is the parent column and ‘Département’ is the children.
Just add your hierarchy in the form like this:
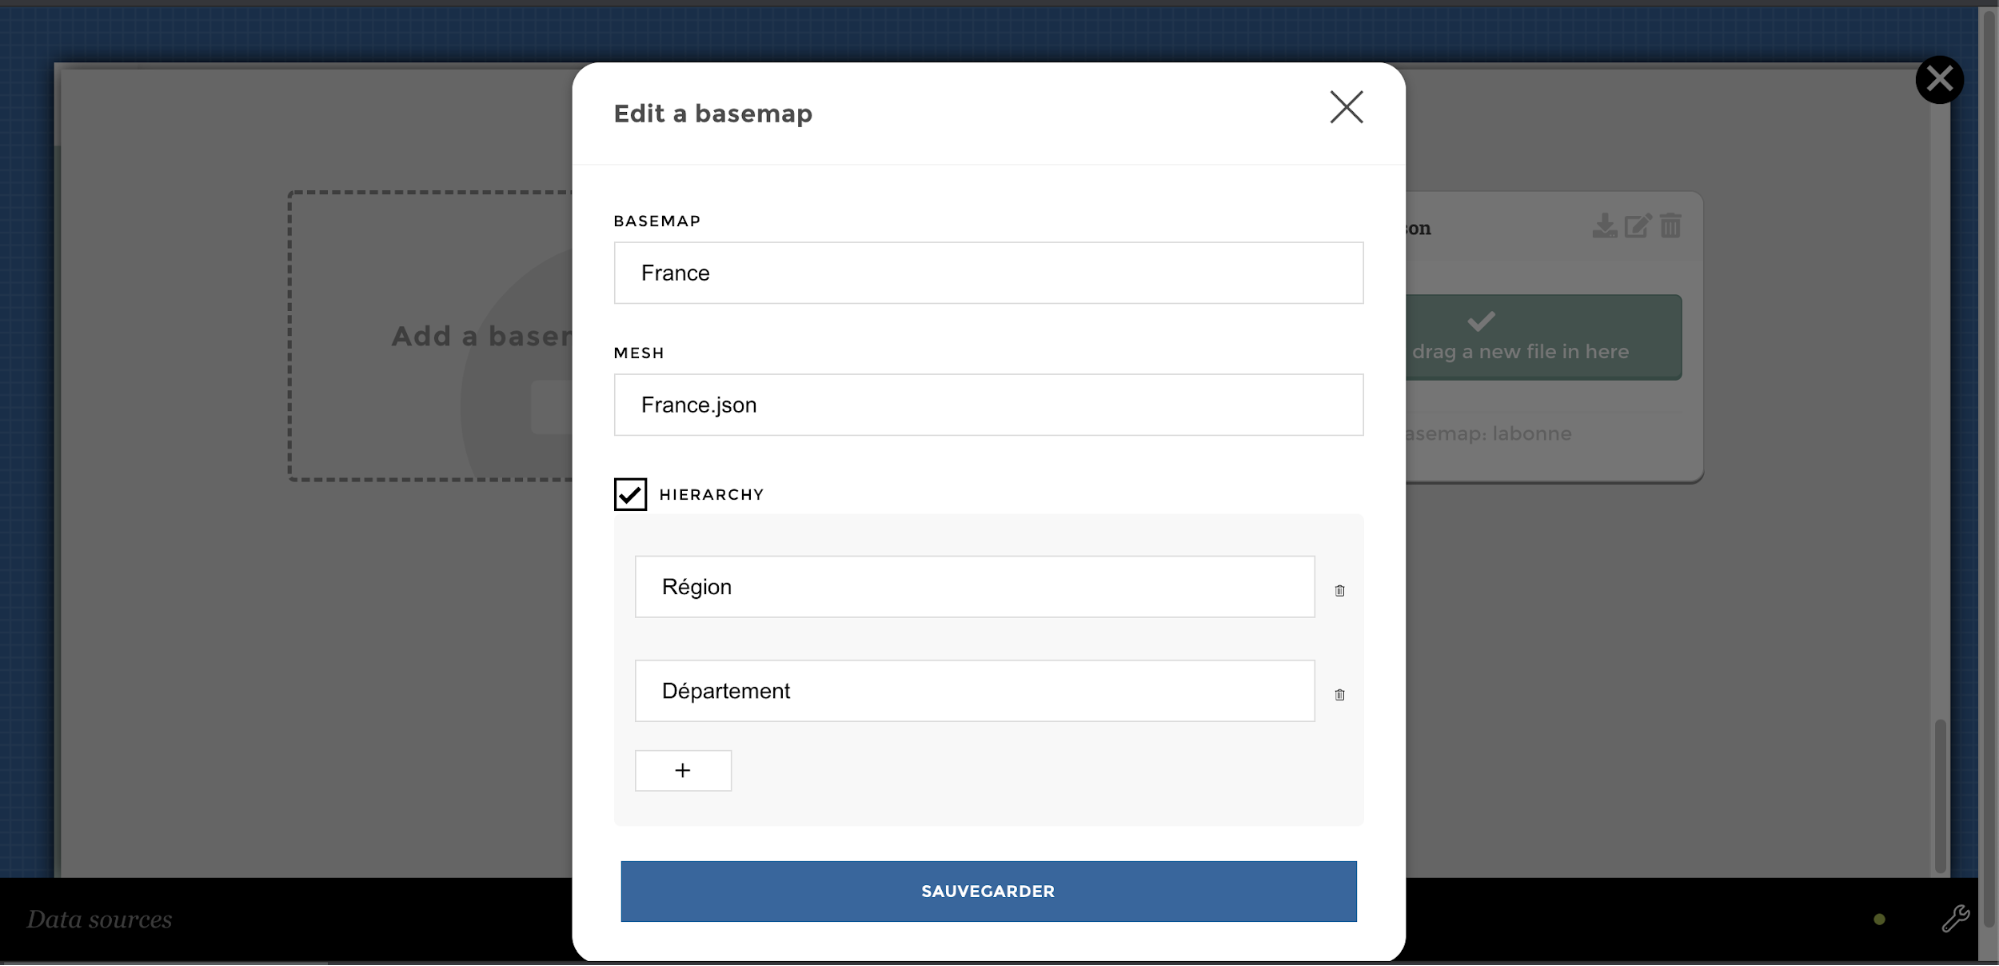
basemap hierarchy
Using the hierarchy parameters, Toucan will automatically create the link between each zones by creating columns and roll ups in your data set (current_id, current_type, id, parent_id and parent_type). Toucan will automatically aggregate zones together, from the top-level to the lower one.
Final step to make the hierarchy come true, the Load basemaps operation. This is when we build the drill in the map.
current_typewill contain the name of the hierarchy column corresponding to the level of this zonecurrent_idwill contain the value of this column for this zoneparent_typeandparent_idto identify the parent zone
So don’t forget to load your basemaps to finalize your drillable mapchart!
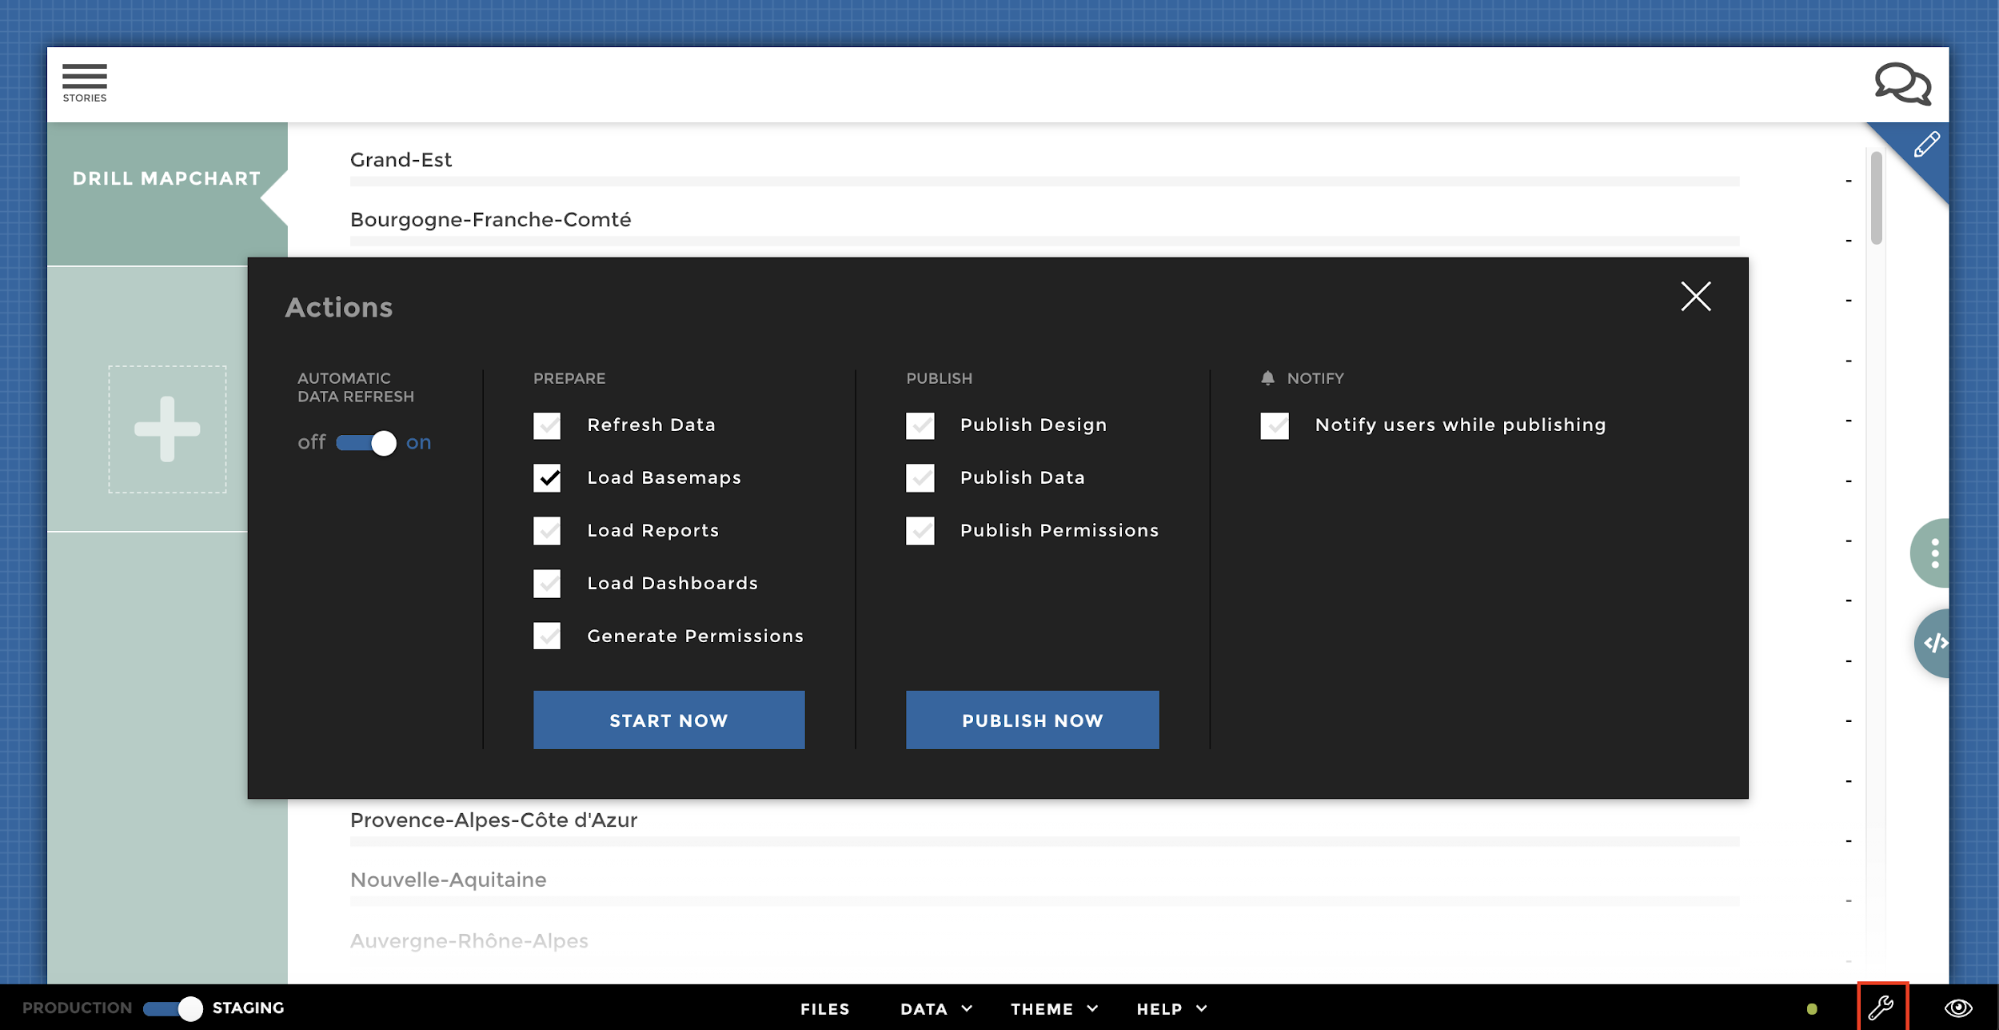
load basemap
In our example, after this load basemap operation, each regions will be
created from the aggregation of their belonging departments 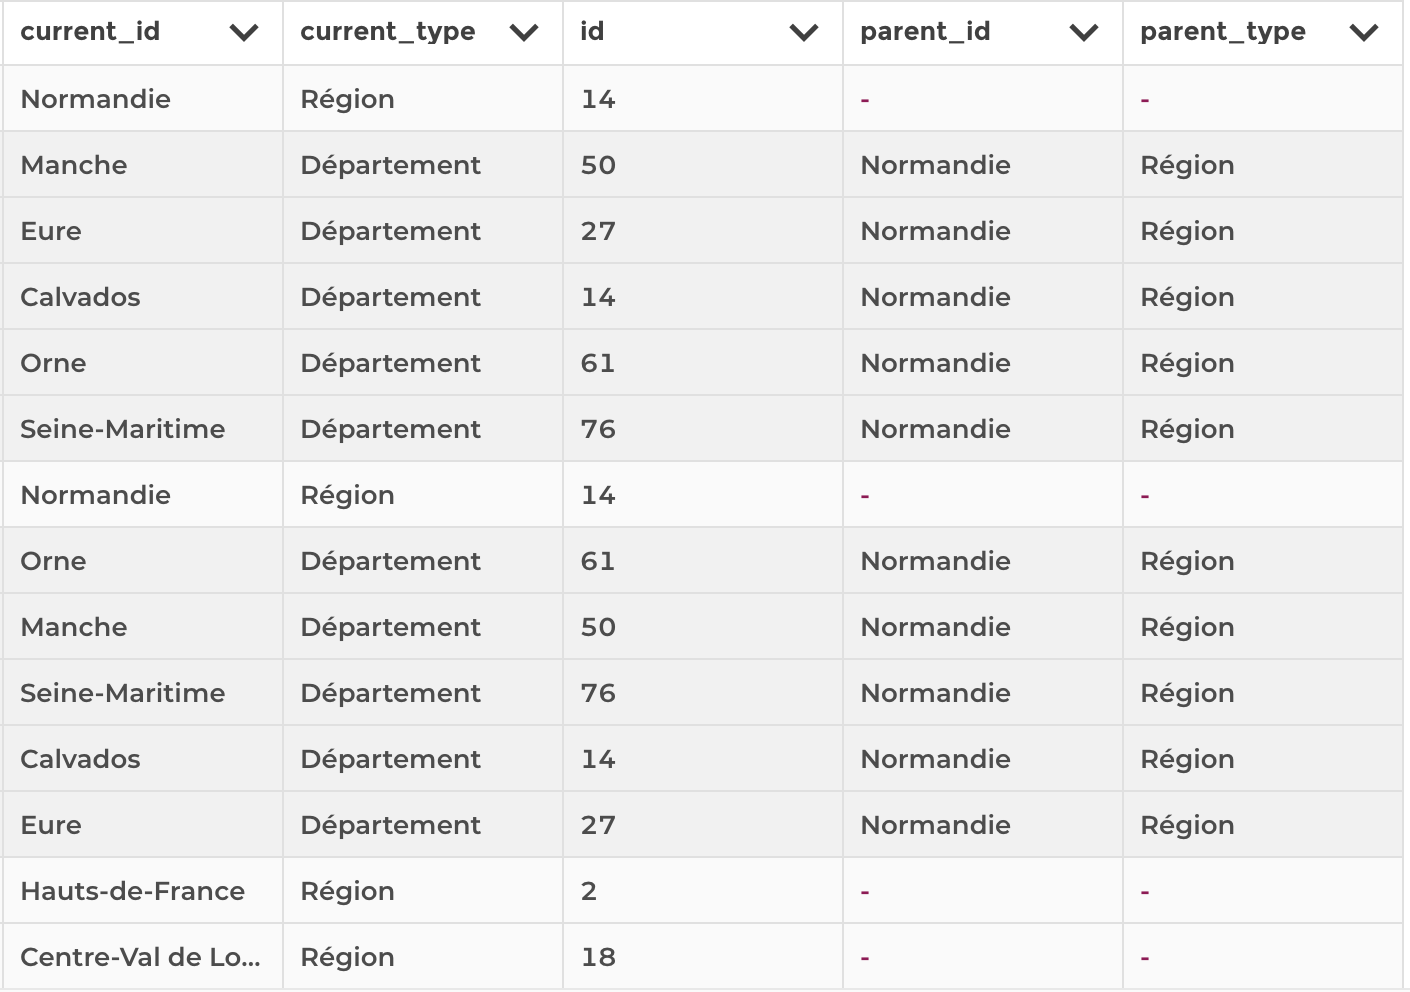
Step 2: Now let’s focus on the dataset:
Download this csv (following the covid for each departments): Drop it into Toucan and create your story :) it should look like this:
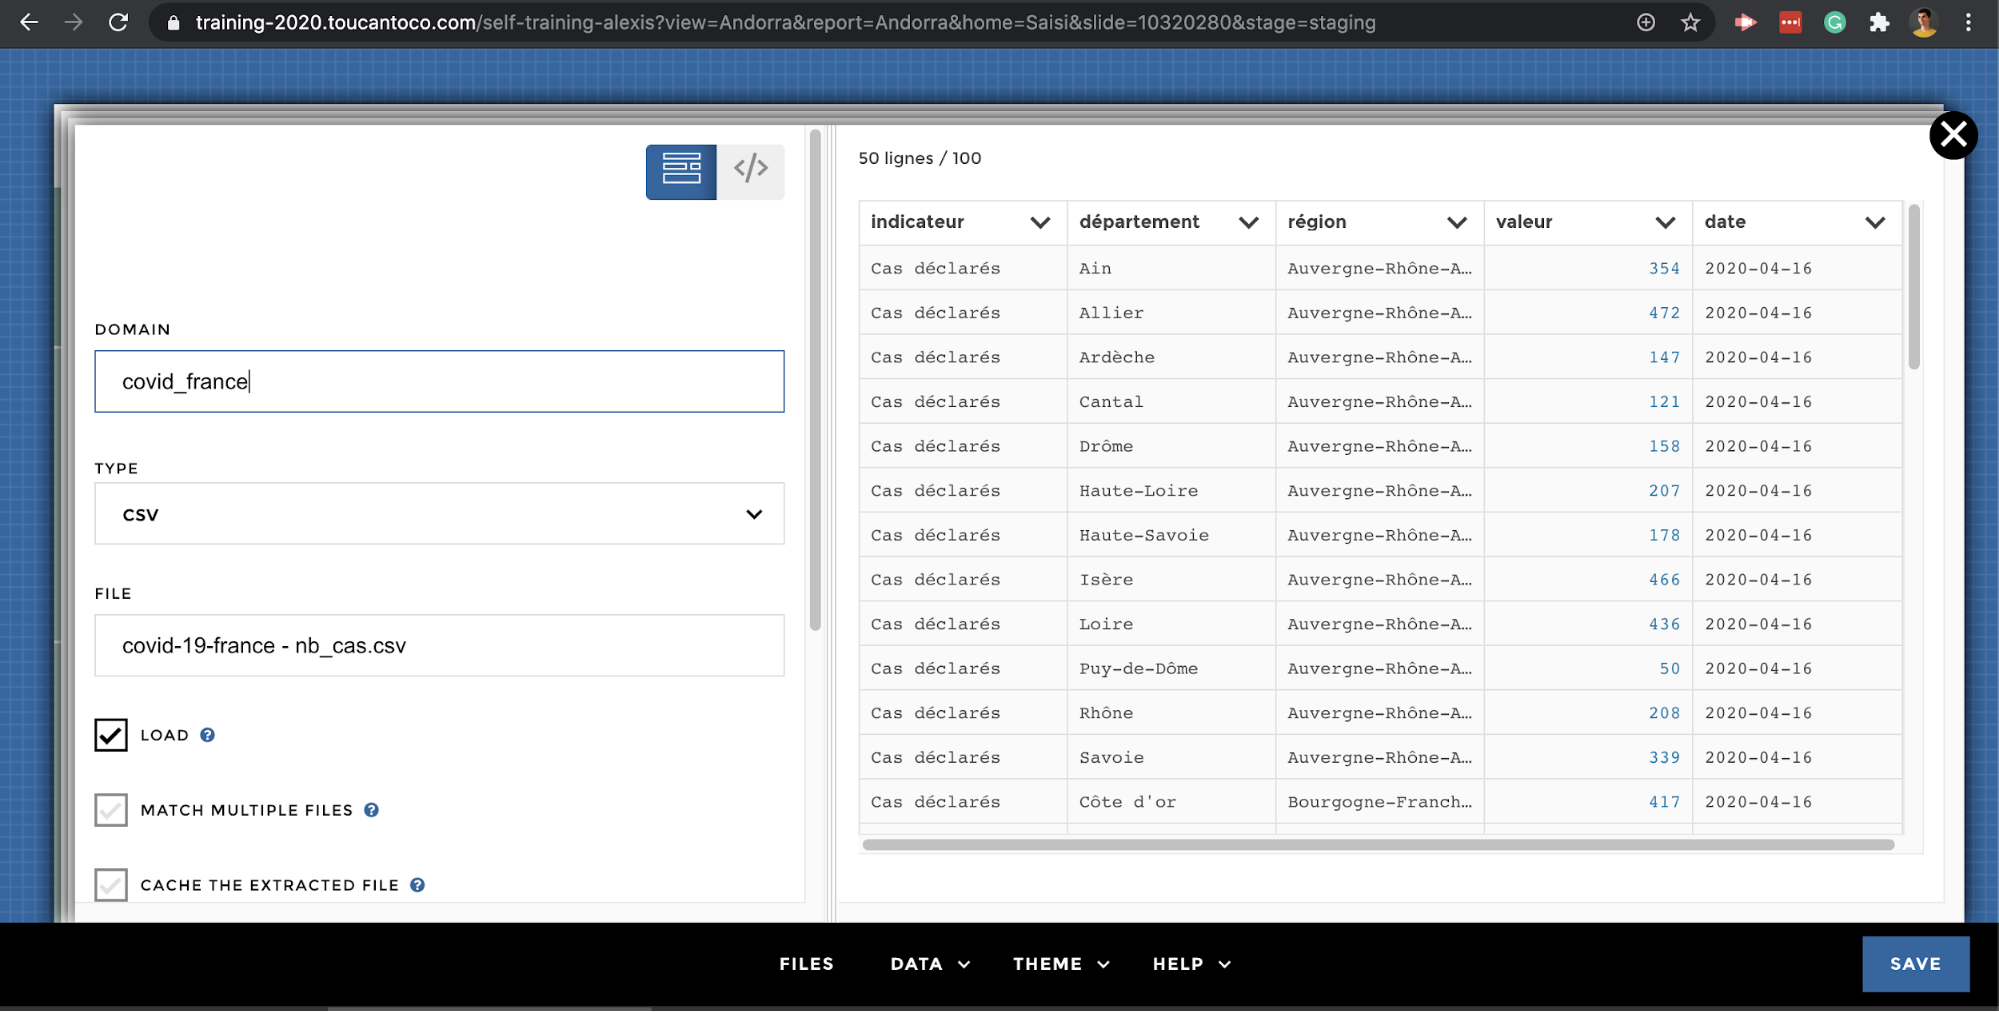
datasource
Start your query by creating the parent value for your département ⇒ It could be done thanks to a hierarchical VQB step:
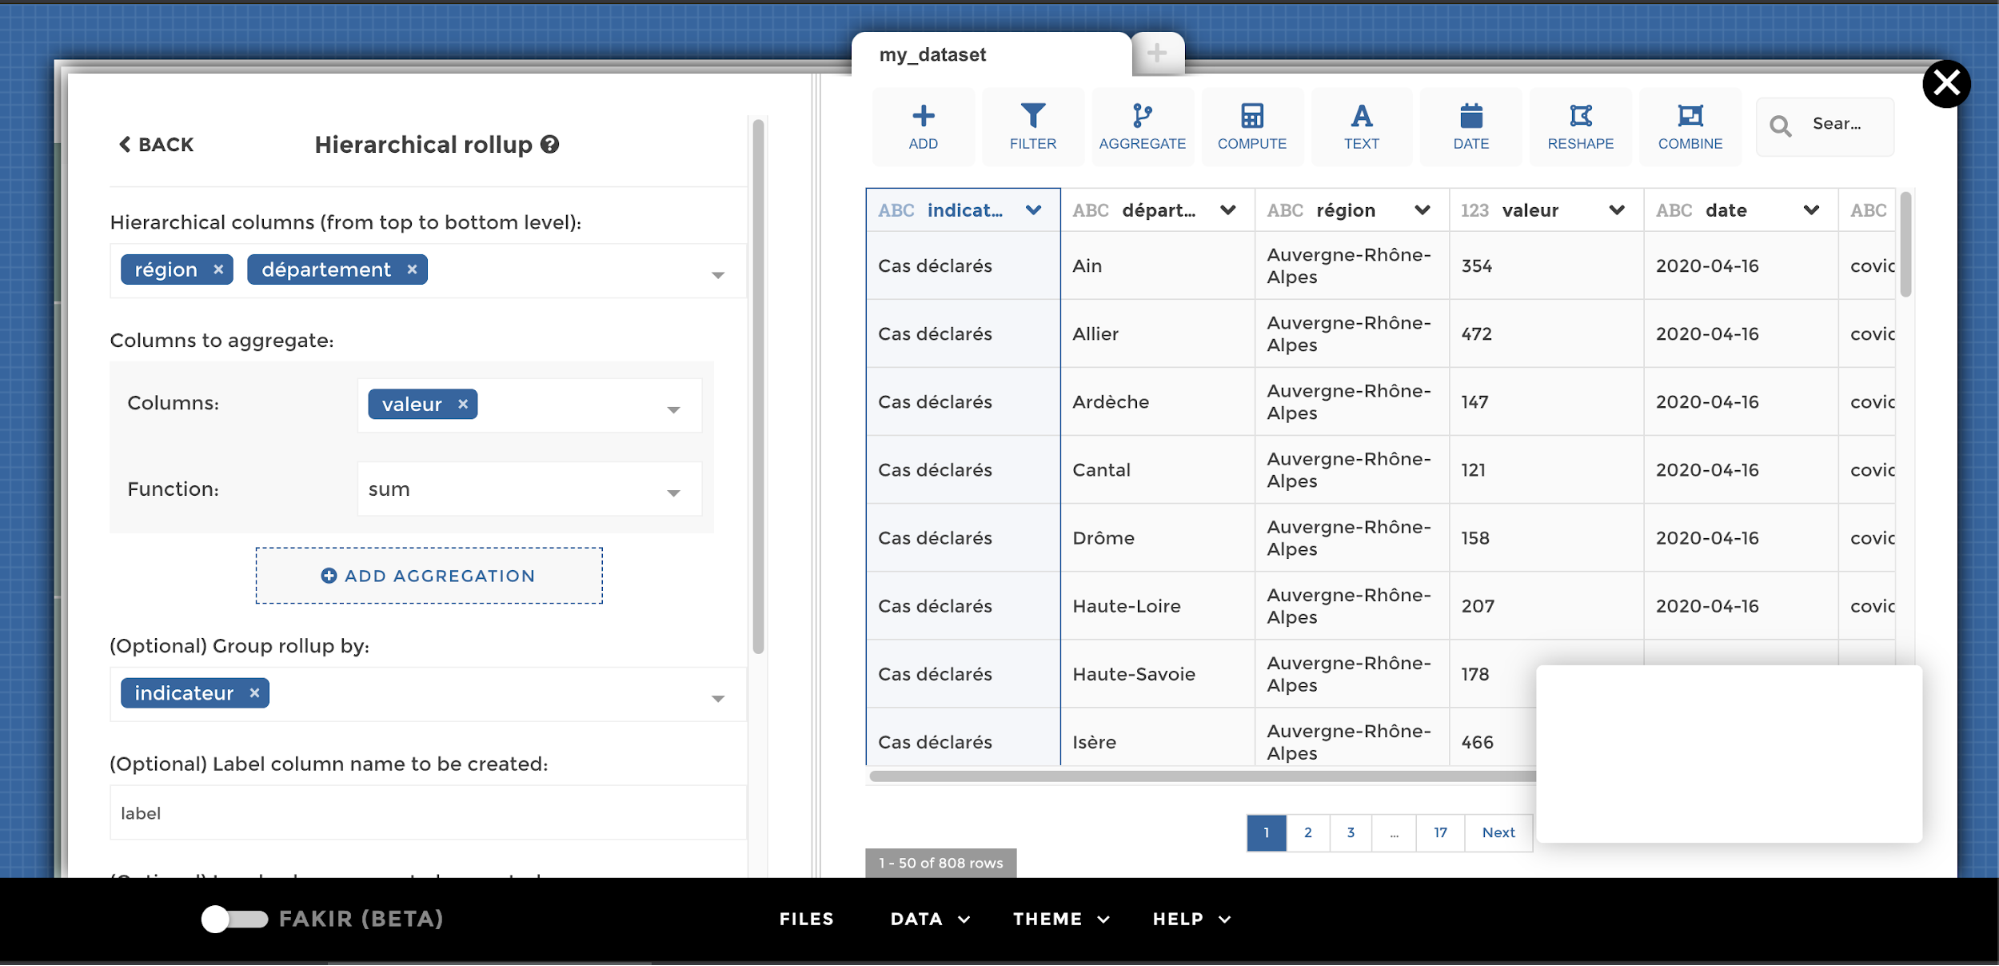
hierarchical
My_dataset is now in a hierarchical structure: 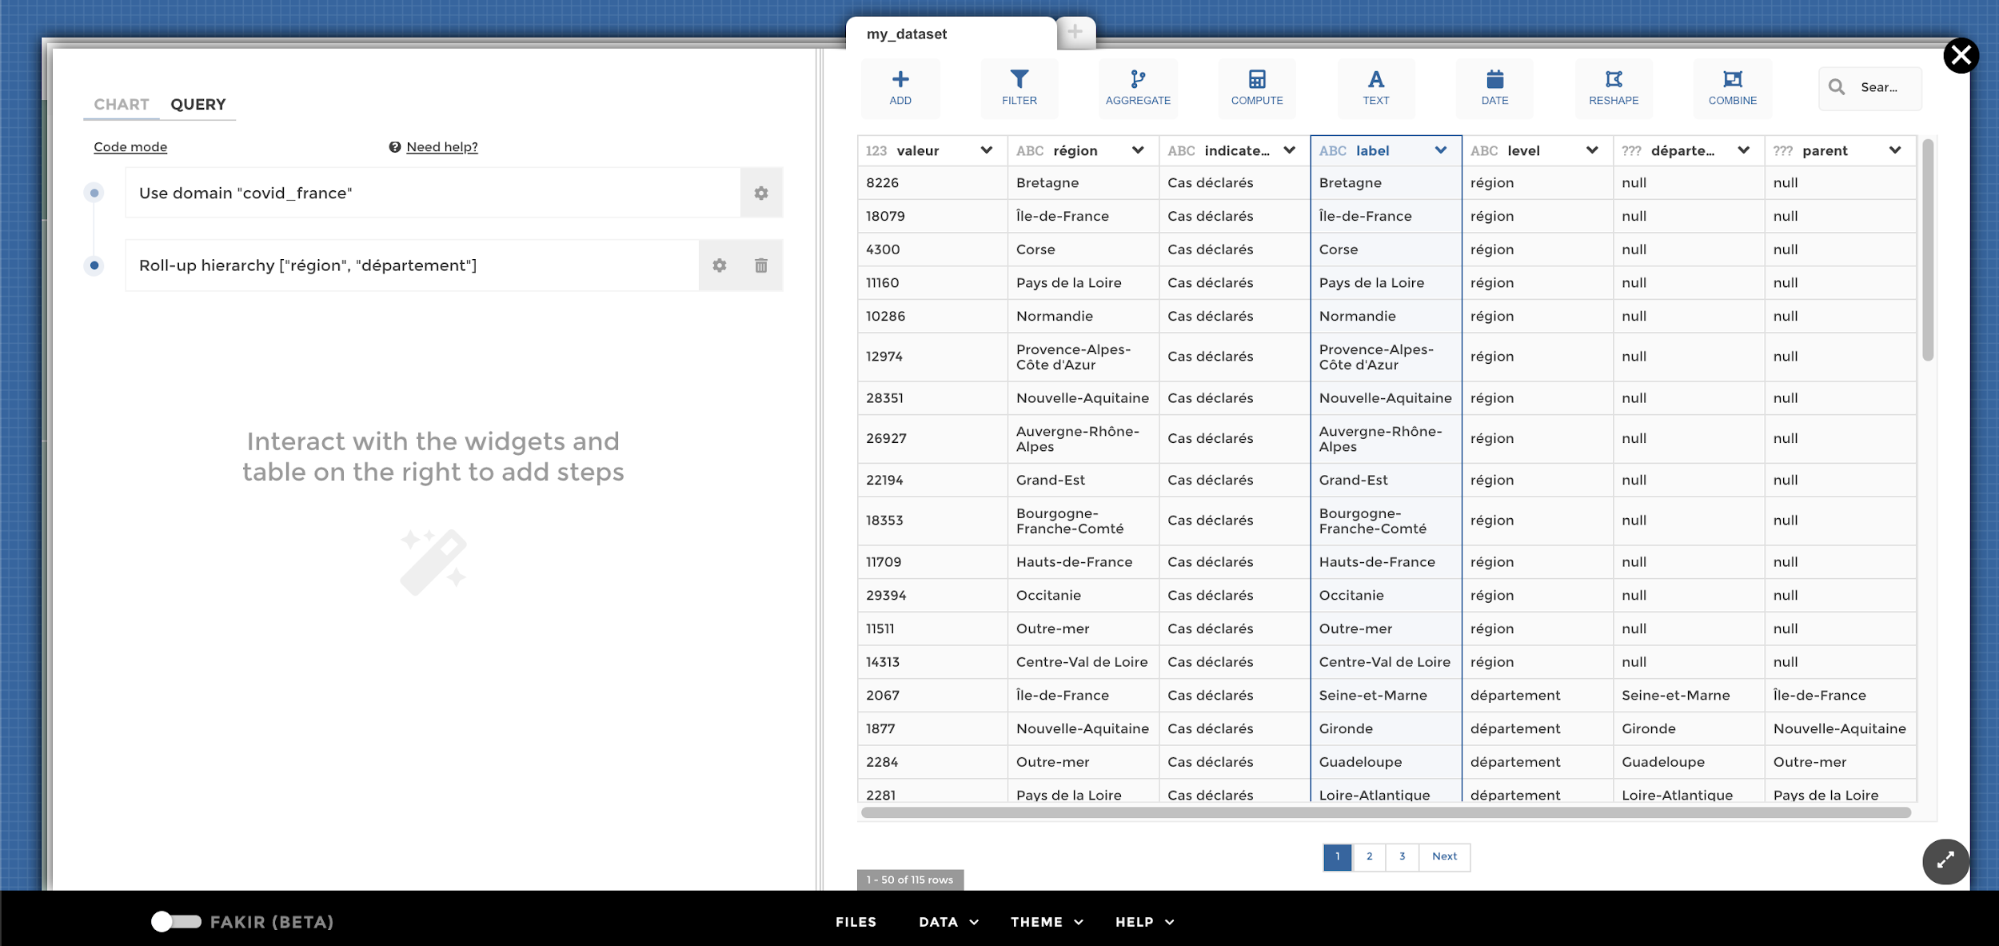
Step 3: Switch in code mode
Warning
At the end of your query you need to add the geofeatures block to define the link between your dataset and your basemaps and a hierarchy block to set up the hierarchy into your dataset. To keep your VQB pipeline, do not switch in code mode directly on your query but follow the previous screenshot ;)
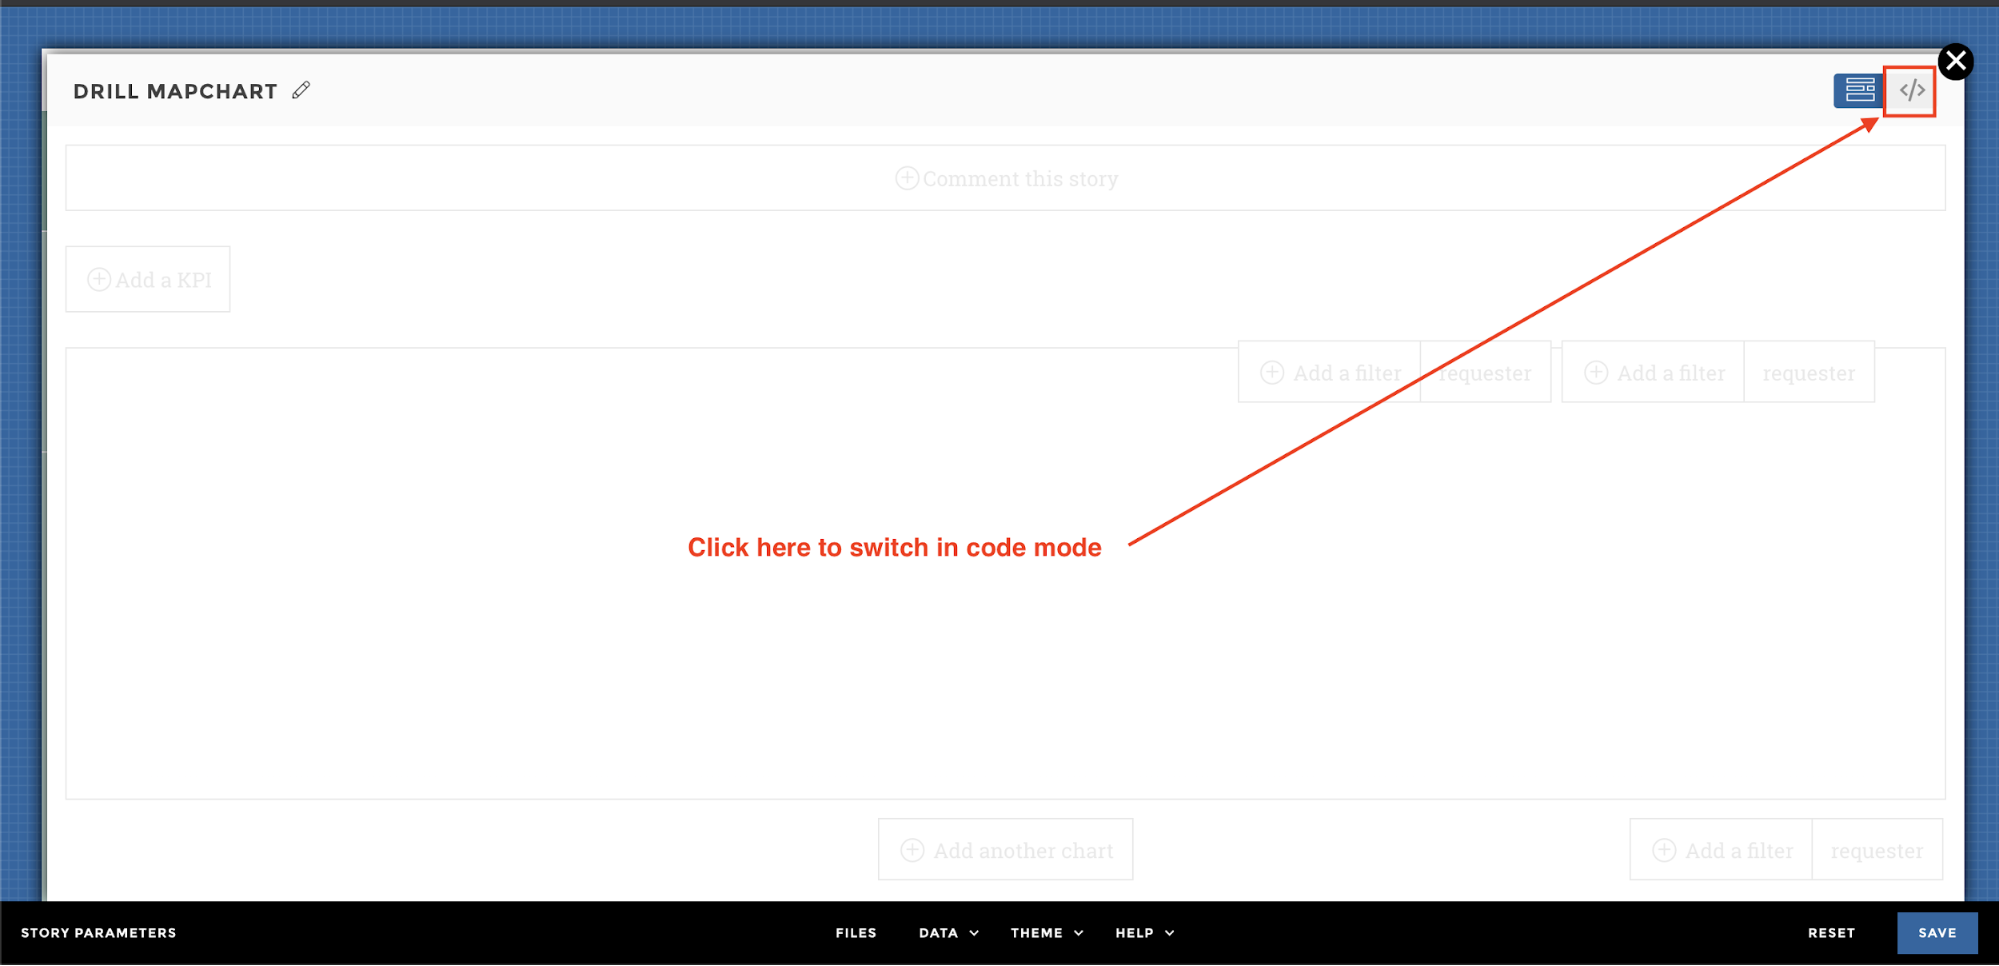
code mode
Step 3-1: Let’s start with the geofeatures:
Usually when setting the geofeatures you just need to fill in two parameters :
- the features,
- the name of your column
Here as you’re using a label that could be a department or a region, you need to use the current_id created by Toucan when you dropped your basemaps with hierarchy.
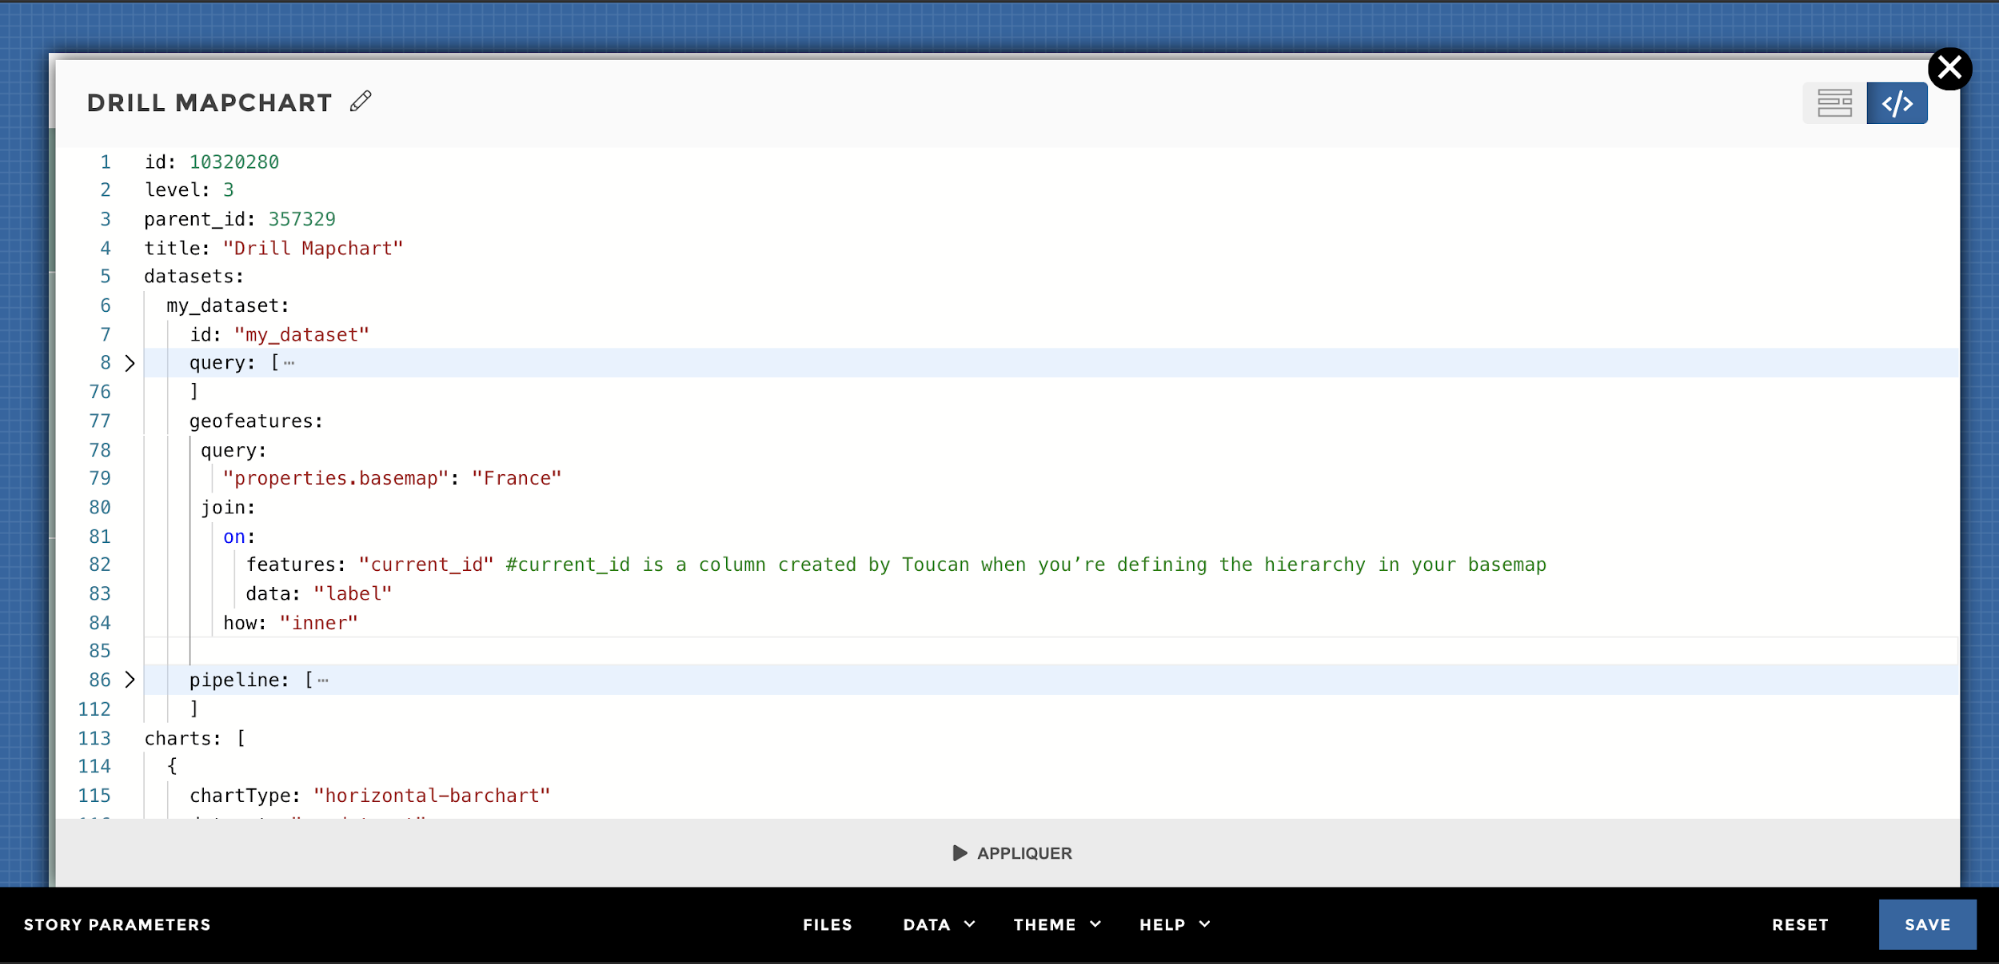
geofeatures
query:
    "properties.basemap": "France"
  join:
    on:
      features: "current_id" #current_id is a column created by Toucan when you’re defining the hierarchy in your basemap
      data: "label"
    how: "inner"
Step 3-2: Let’s go forward with the hierarchy:
📚 You can take a look to the documentation about the hierarchy
hierarchy 1
The columns added by the “Populate basemaps” operation
(current_type, current_id, parent_type, parent_id) are
ready to use with in the hierarchy property. You can copy/paste the
following code👇:
hierarchy:
    id: [
    "current_id"
    "current_type"
         ]
    parent: [
      "parent_id"
      "parent_type"
         ]
It’s looking like this in code mode 👉: 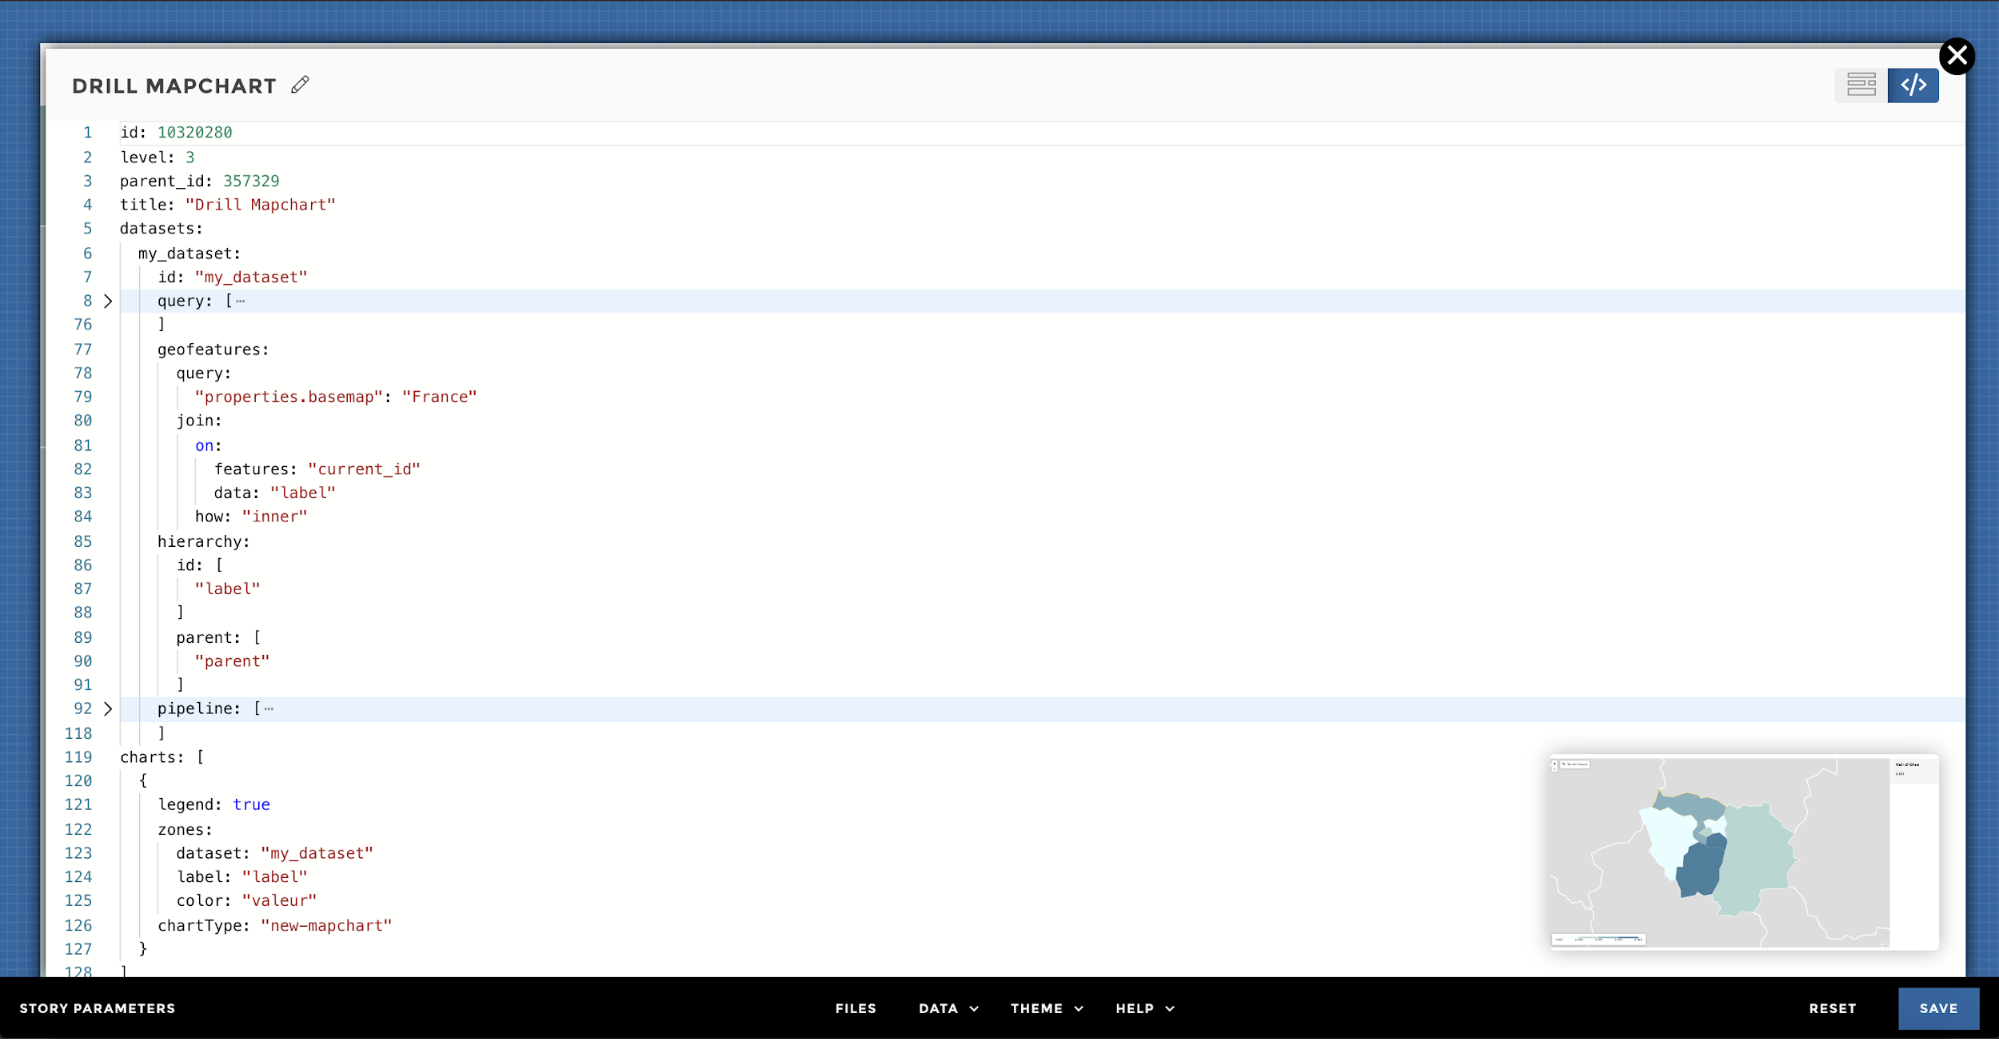
Here you go 🎉 For your parent level…: 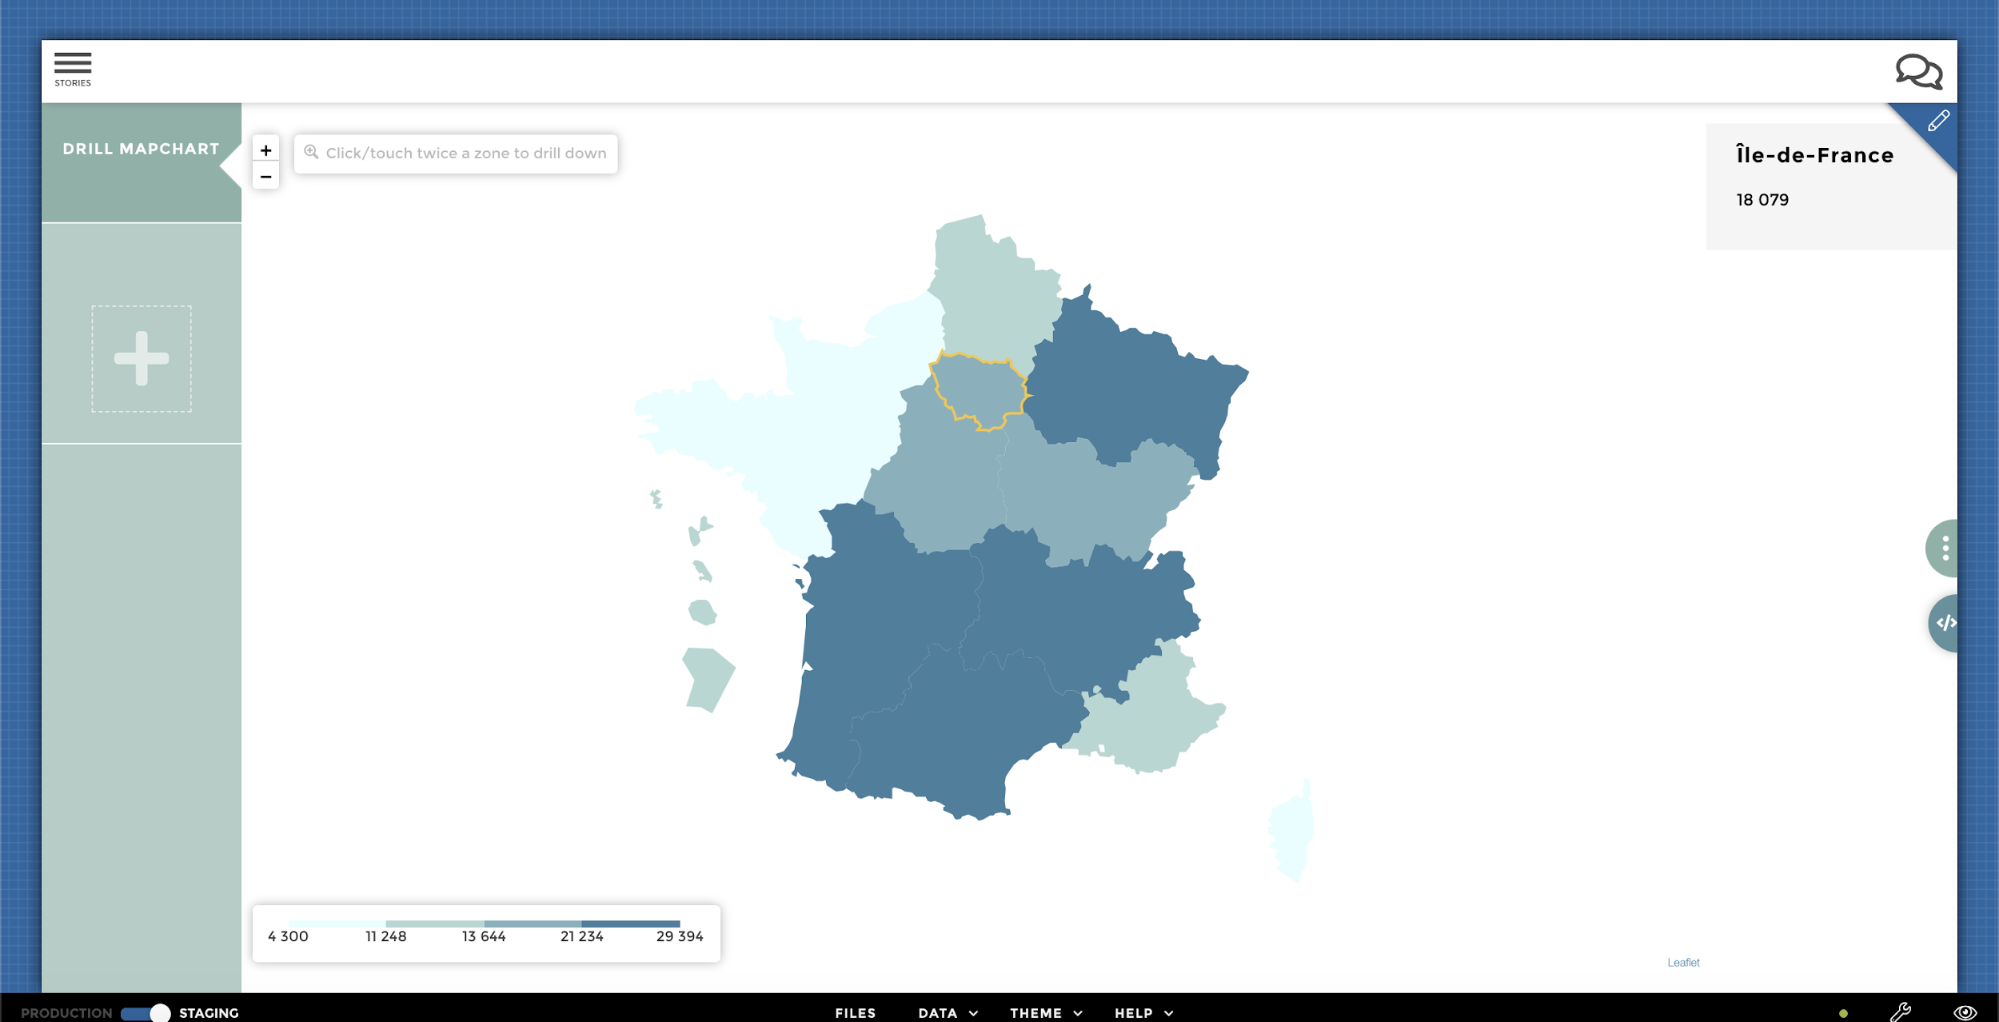
…And your children level 🎉: 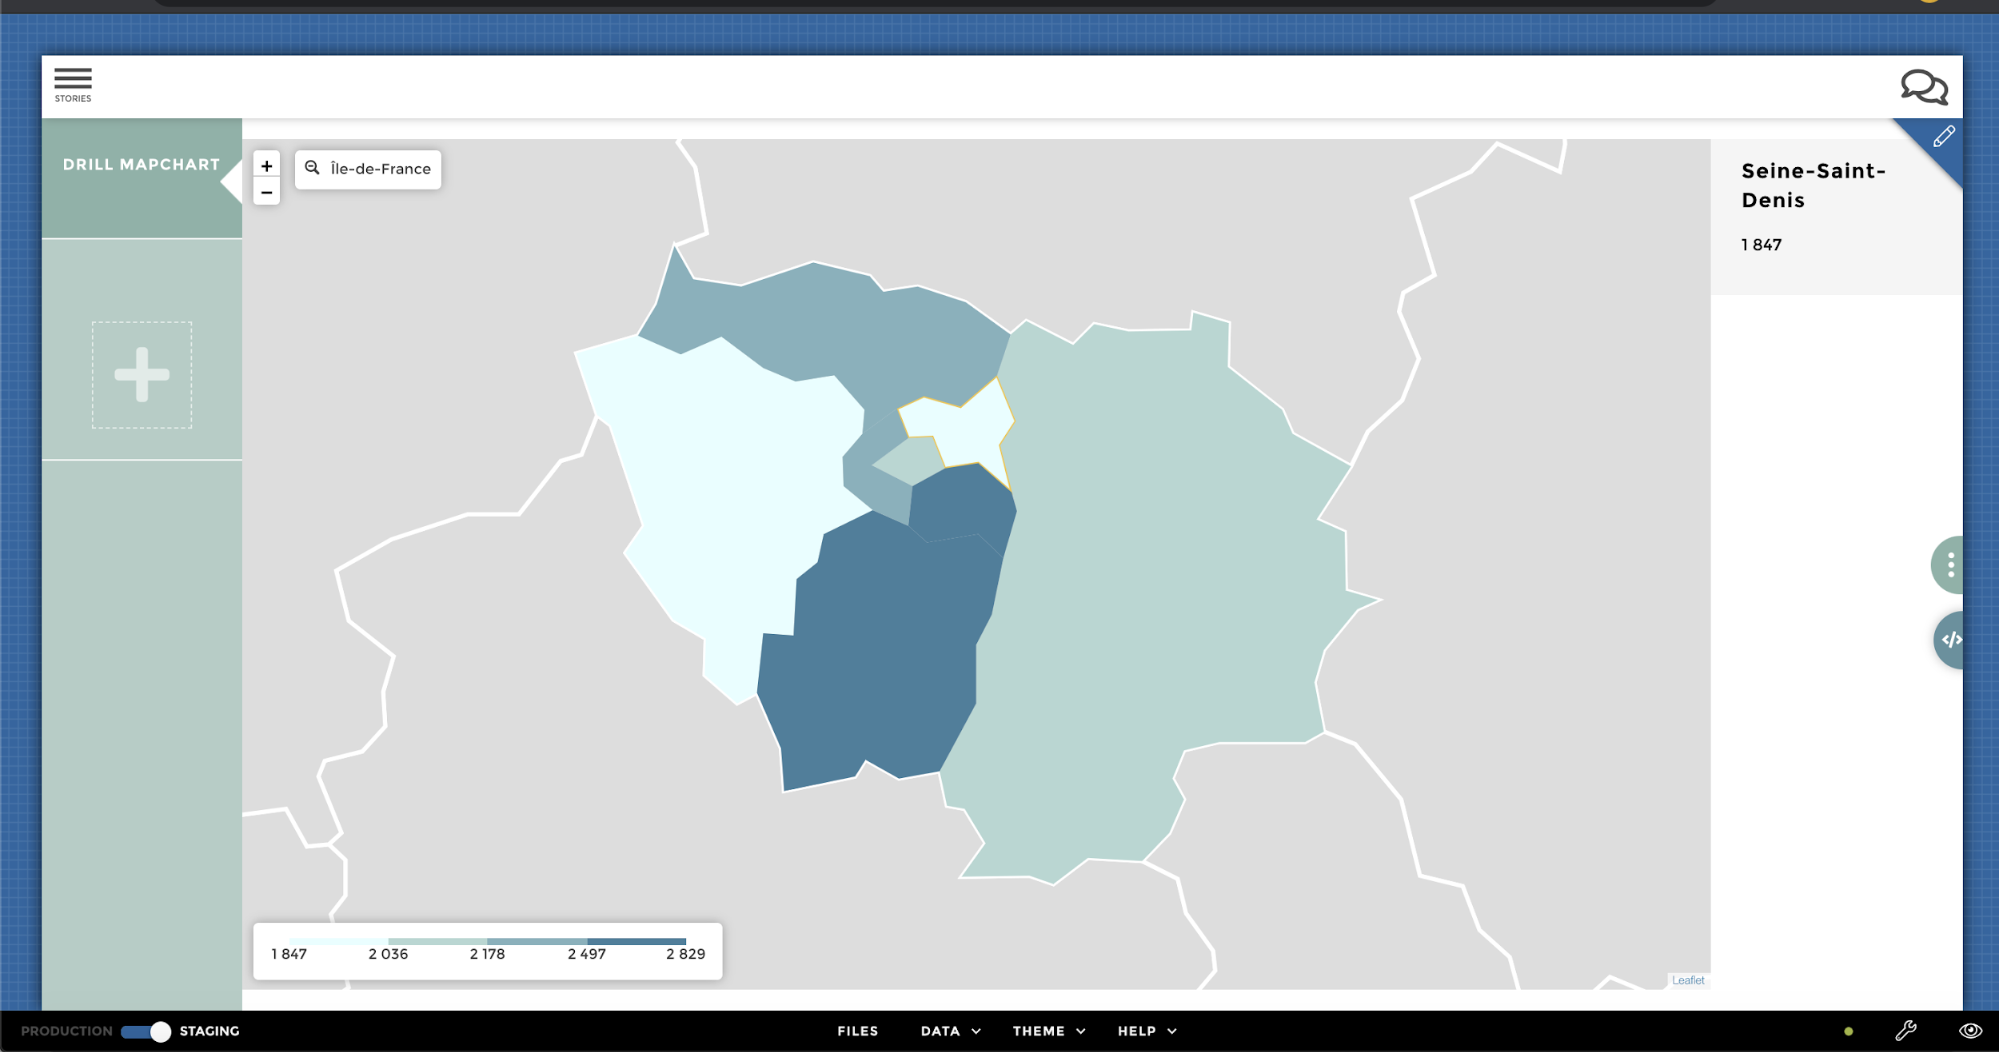
Lazy
When having a lot of rows and levels, fetching everything at once can be costly and slow. That’s why it’s possible to load only the top drill level, then the subsequent ones only when required. See the docs about laziness in hierarchical datasets.
How to also lazy load our geographical zones the ame way we do with the data rows?
By default, when the lazy mode is activated, the hierarchy root,
id and parent columns also applies to geofeatures. For this to work,
geofeatures must have the same column in their properties.
With common hierarchy columns
Here is a very simple example of data and geofeatures that shares the
same hierarchy columns (location and parent_location):
| parent_location | location | value |
|---|---|---|
| France | 65000000 | |
| France | Île-de-France | 12000000 |
| Île-de-France | Paris | 3000000 |
[
  {
    "properties": {
      "basemap": "france_zones",
      "location": "France"
    },
    "geometry": [...]
  },
  {
    "properties": {
      "basemap": "france_zones",
      "parent_location": "France",
      "location": "Île-de-France"
    },
    "geometry": [...]
  },
  {
    "properties": {
      "basemap": "france_zones",
      "parent_location": "Île-de-France",
      "location": "Paris"
    },
    "geometry": [...]
  }
]
In this case, the hierarchy configuration apply to both data and
geofeatures:
query:
  domain: "france_data"

geofeatures:
  query:
    "properties.basemap": "france_zones"
  join:
    on:
      data: "location"
      features: "location"

hierarchy:
  id: ["location"]
  parent: ["parent_location"]

lazy: true
With different hierarchy columns
When data and features have different columns names representing the
hierarchy, it’s possible to make them correspond by having one
hierarchy property for the data and one for the geofeatures
(with the same nomenclature as the usual hierarchy parameter
(id, parent and root)).
Here is a simple example:
| parent_location | location | value |
|---|---|---|
| France | 65000000 | |
| France | Île-de-France | 12000000 |
| Île-de-France | Paris | 3000000 |
[
  {
    "properties": {
      "basemap": "france_zones",
      "zone_id": "France"
    },
    "geometry": [...]
  },
  {
    "properties": {
      "basemap": "france_zones",
      "parent_zone_id": "France",
      "zone_id": "Île-de-France"
    },
    "geometry": [...]
  },
  {
    "properties": {
      "basemap": "france_zones",
      "parent_zone_id": "Île-de-France",
      "zone_id": "Paris"
    },
    "geometry": [...]
  }
]
In this case, the hierarchy configuration must be different for data
and geofeatures:
query:
  domain: "france_data"

hierarchy:
  id: ["location"]
  parent: ["parent_location"]

geofeatures:
  query:
    "properties.basemap": "france_zones"
  join:
    on:
      data: "zone_id"
      features: "location"
  hierarchy:
    id: ["zone_id"]
    parent: ["parent_zone_id"]

lazy: true
Use it in charts!
The mapchart will now display the zones associated to its zones
dataset, without any extra configuration.
See some examples on the mapchart docs