Hierarchy
Create multi-level experiences that reflect the hierarchy of your data
Declare hierarchy columns
When making a data request, you can declare that it contains a
hierarchy. A hierarchy is described by columns that link children
rows to their parent.
Given the following data request:
query:
  domain: "hierarchy_country"
| parent_location | location | value |
|---|---|---|
| France | 65000000 | |
| France | ile de france | 12000000 |
| ile de france | paris | 3000000 |
| ile de france | yvelines | 1000000 |
| Espagne | 46000000 | |
| Espagne | catalogne | 7000000 |
| catalogne | tarragone | 131000 |
| catalogne | barcelone | 1600000 |
| Luxembourg | Luxembourg | 590000 |
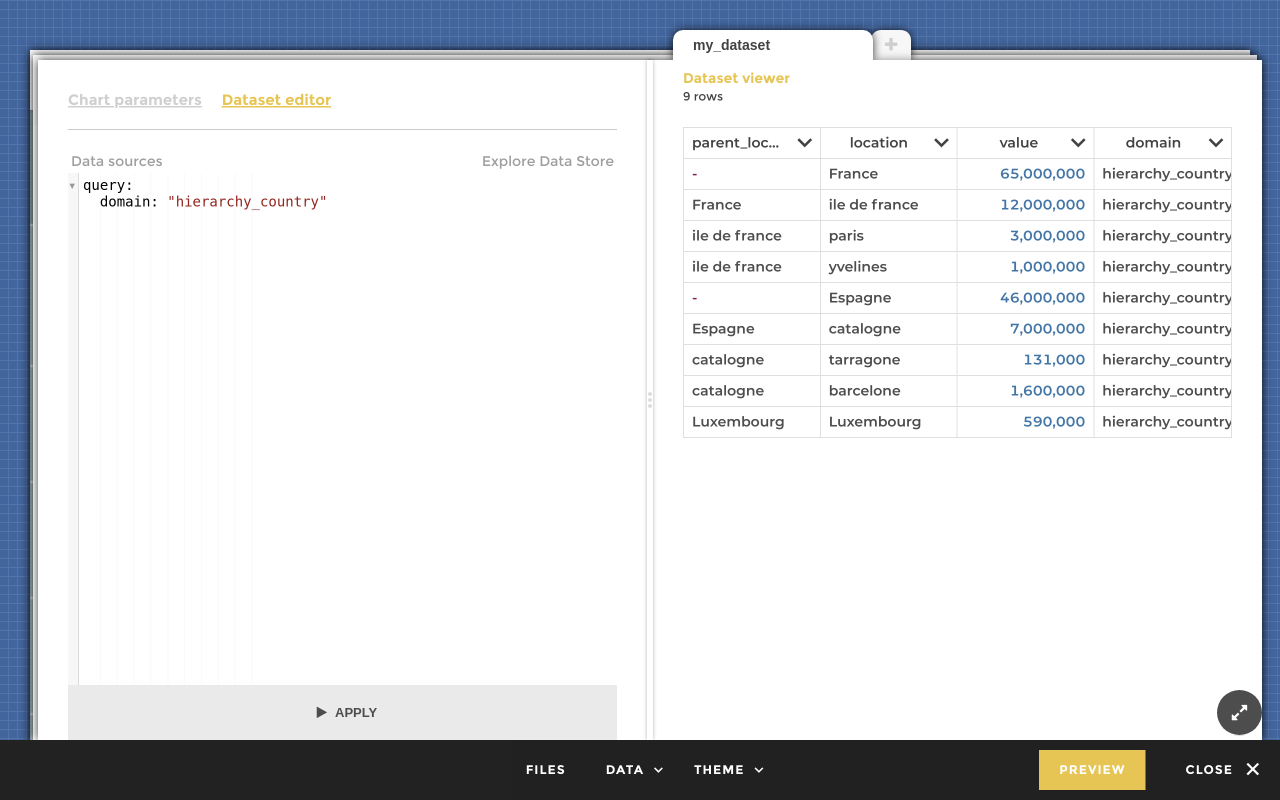
Sample hierarchical data
Adding hierarchy allows to the see the children nested into their
parent:
query:
  domain: "hierarchy_country"
hierarchy:
  id: ["location"]
  parent: ["parent_location"]
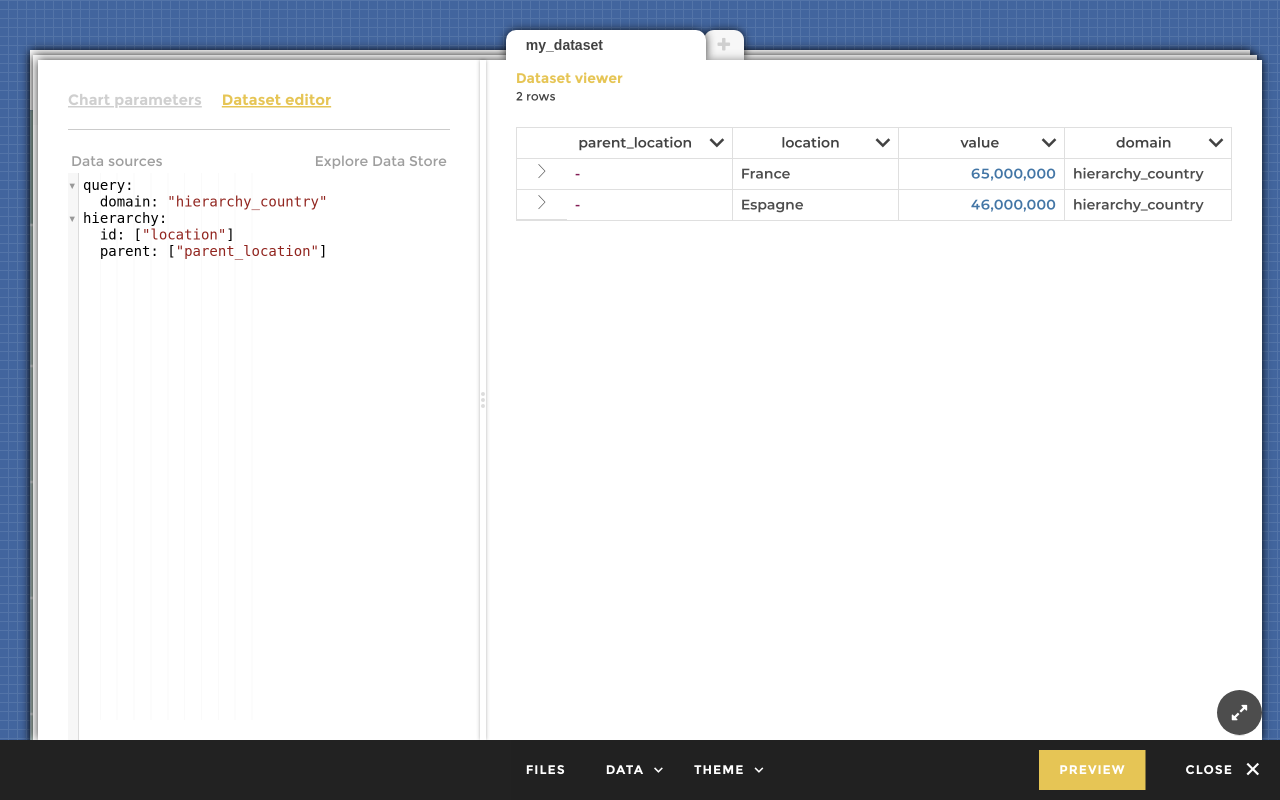
Collapsed rows
Hitting the caret expands children:
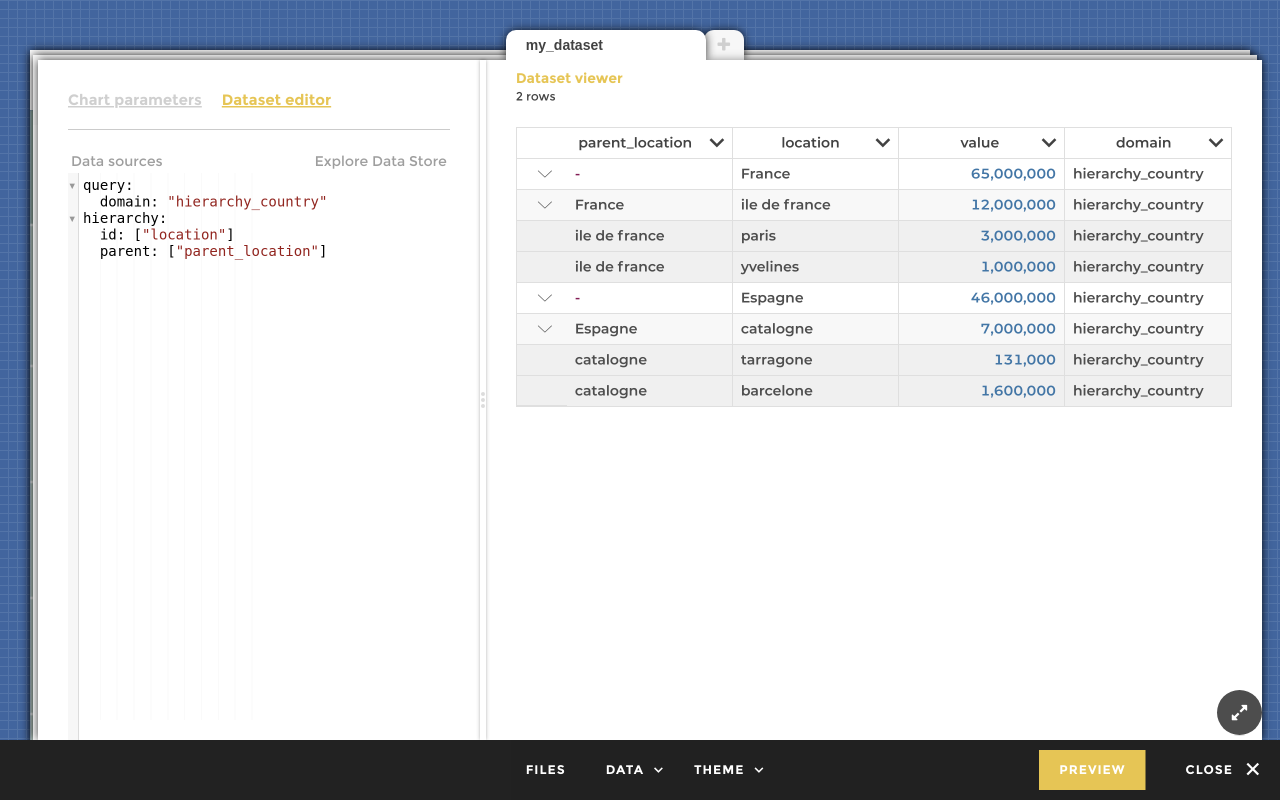
Drilling to deeper levels
hierarchy.idandhierarchy.parentcan accept more than one column. In that case, beware that the order used in id columns must be the same used in parent columns, like this:
coffee hierarchy: id: ["type", "name"] parent: ["parent_type", "parent_type"]
| parent_type | parent_name | type | name |
|---|---|---|---|
| continent | Europe | ||
| continent | Europe | country | France |
| continent | Europe | country | Germany |
| continent | Asia | ||
| continent | Asia | country | Japan |
| continent | Asia | country | South Korea |
Adding dimensions columns
Often, more columns are used to identify a data row than just the hierarchy. Therefore, all of them must be known in order to match them with the correct parent.
Given the following data request:
query:
  domain: "hierarchy_country"
| parent_location | location | value | metric_type |
|---|---|---|---|
| France | 65000000 | population | |
| France | ile de france | 12000000 | population |
| ile de france | paris | 3000000 | population |
| ile de france | yvelines | 1000000 | population |
| Espagne | 46000000 | population | |
| Espagne | catalogne | 7000000 | population |
| catalogne | tarragone | 131000 | population |
| catalogne | barcelone | 1600000 | population |
| Luxembourg | Luxembourg | 590000 | population |
| France | 643801 | superficie | |
| France | ile de france | 12012 | superficie |
| ile de france | paris | 105 | superficie |
| ile de france | yvelines | 2284 | superficie |
| Espagne | 505911 | superficie | |
| Espagne | catalogne | 31950 | superficie |
| catalogne | tarragone | 62 | superficie |
| catalogne | barcelone | 100 | superficie |
| Luxembourg | Luxembourg | 2586 | superficie |
With the metric_type column, we note that for each hierarchical
level, we now have two rows. Therefore, we do want that
(paris | ile de france | population) is nested into
(ile de france | France | population) and not into
(ile de france | France | superficie).
That’s why it’s necessary to declare in the dimensions list any
column that is needed to find the correct parent:
query:
  domain: "hierarchy_country_pop_surf"
hierarchy:
  id: ["location"]
  parent: ["parent_location"]
dimensions: ["metric_type"]
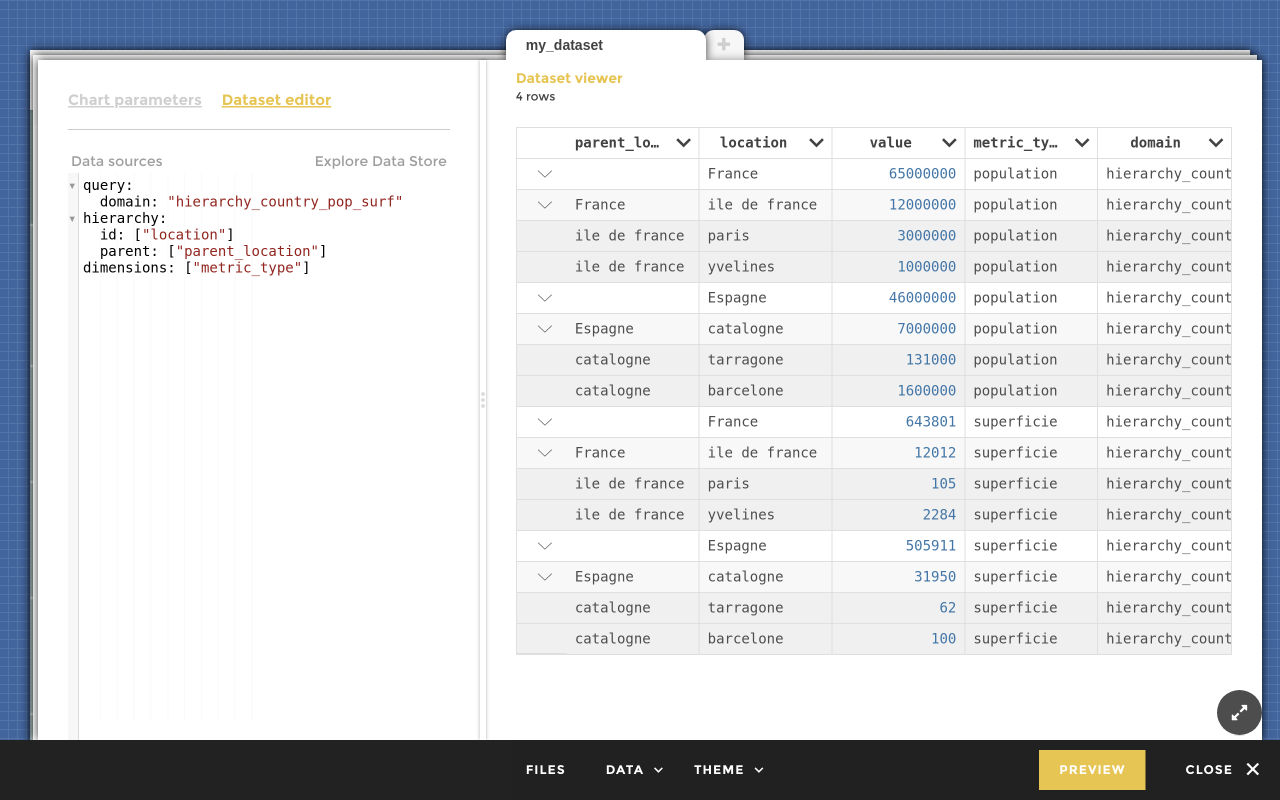
Drilled dataset with dimension column
Lazy or not
When having a lot of rows and levels, fetching everything at once can be costly and slow. Furthermore, it’s generally useless as users will probably have interest only in a small part of the hierarchy tree.
In this case, adding lazy: true to the data request will fetch only
the top-level of the hierarchy. Subsequent levels will only be requested
when drilling the parent row.
query:
  domain: "hierarchy_country"
hierarchy:
  id: ["location"]
  parent: ["parent_location"]
  root: [null]
lazy: true
will fetch only:
| parent_location | location | value |
|---|---|---|
| France | 65000000 | |
| Espagne | 46000000 | |
| Luxembourg | Luxembourg | 590000 |
Therootattribute enables to choose the starting point of the hierarchy. Typically, to exclude other countries from the drillroot: "Espagne"would only return:
| parent_location | location | value |
|---|---|---|
| Espagne | catalogne | 7000000 |
Hitting the France row will retrieve only its children:
| parent_location | location | value |
|---|---|---|
| France | ile de france | 12000000 |
And hitting ile de france:
| parent_location | location | value |
|---|---|---|
| ile de france | paris | 3000000 |
| ile de france | yvelines | 1000000 |
Use it in charts!
Some charts support the display of drilled levels:
horizontal-barchartshows one sub-level when selecting an elementmapchartsupports an infinite drill (don’t abuse it!)- more soon…
And that’s it! You don’t need any additional configuration outside your data request, the chart will automatically detect that its dataset has children rows.