Dynamic value tile :: step by step
Tip
Hello! 👋 If you are here, it’s probably to learn more about the new Dynamic Value Tile! You’ve come to the right place :)
You will find below a tutorial to learn progressively.
Are you ready? On your data… Ready? Go! 🏁.
Step by step tutorial
The user story
I am a manager or director in a company. I manage my teams or my department using key performance indicators. I wish to have at hand, an access and a fast vision on a priority indicator in order to pilot the activity:
- What is the value of my indicator?
- Is this indicator positive or negative, in relation to a target or a variation?
- What is the variation of this indicator compared to a previous period?
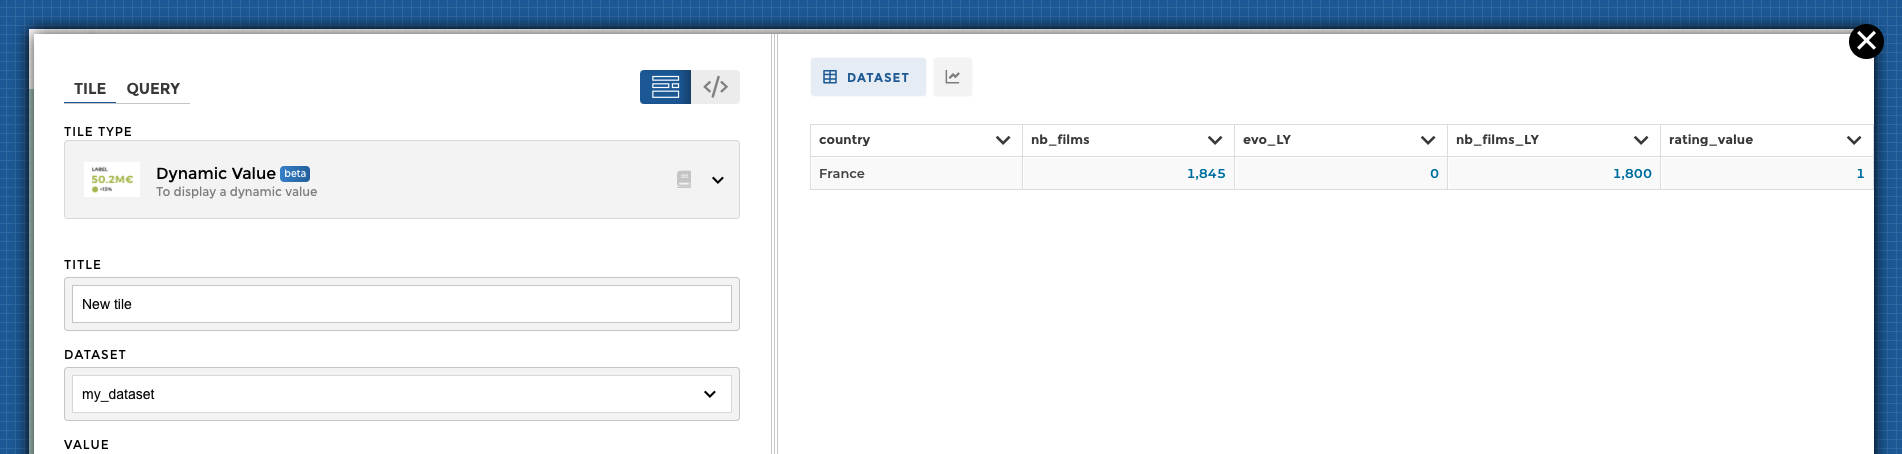
Pick some data
You can download this excel file and import it into Toucan :)
| country    | nb_films | evo_LY | nb_films_LY | rating_value |
|------------|----------|--------|-------------|--------------|
| France     | 1845     | 0,025  | 1800        | 0,6          |
This dataset is used for all the following examples
The objective of the new tile value is to highlight an indicator, and possibly its evolution(s).
This is why the new tile value only displays one line of data! If you have more than one, you will have to aggregate or filter rows.
Tiles parameters
Requirements
- Have a dataset imported into Toucan, and one line of data so far (or by default the first lign will be displayed)
- Create a New Tile on your Home and use the uploaded dataset
- Select Dynamic Value in the dropdown Tile Type
Then we can start! 🙌
Mandatory options
- First, give an understandable title to your tile.
- What KPI are you displaying ?
- Fill in the
valuefield with the column containing the value to be displayed, for instancerevenue
- You can add units and/or precisions to better display your value
- You can also add some color coding (sentiment) to really convert your value into insights
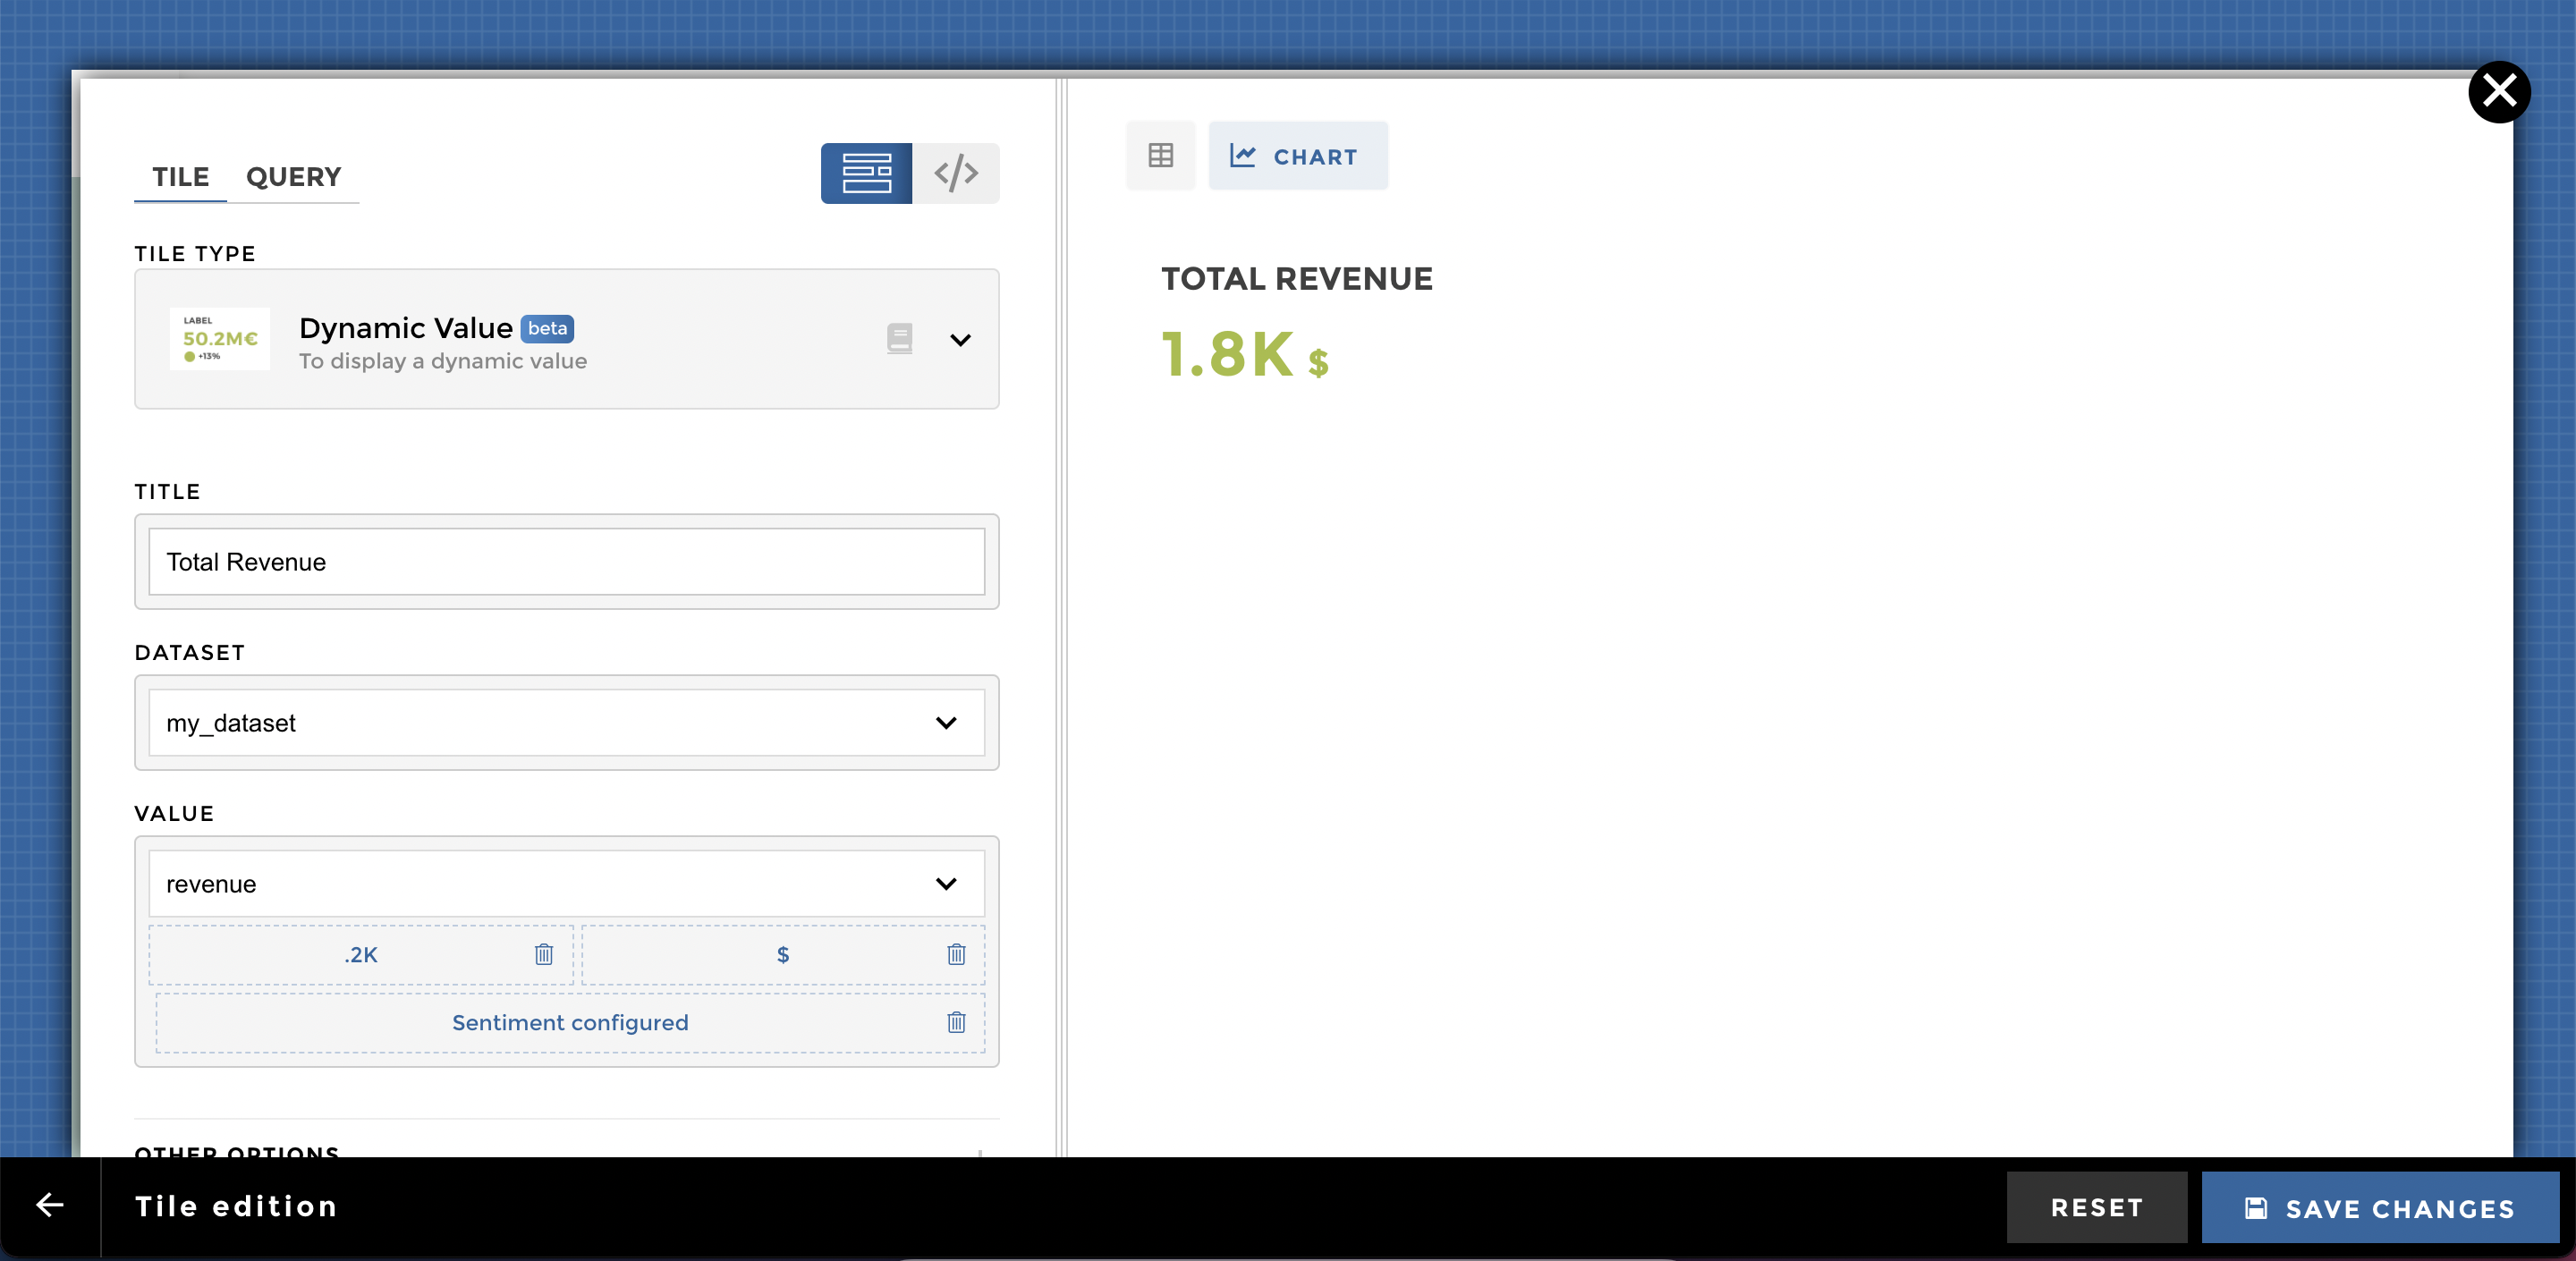
Congrats, you’ve just built a nice tile !
Optional parameters
You can go even further with this amazing dynamic value by adding more options that turns data into actionnable insights 🔥
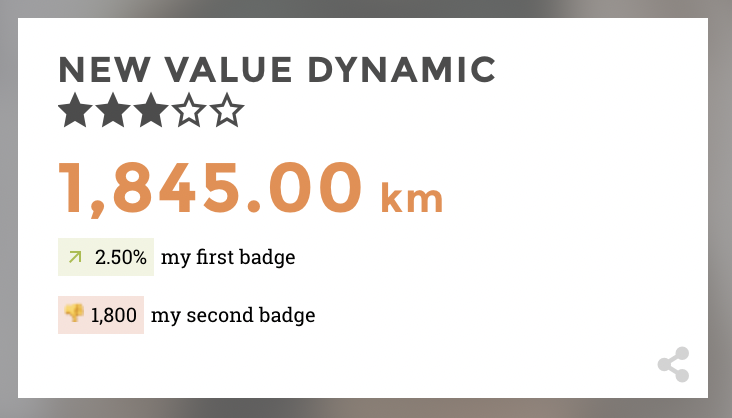
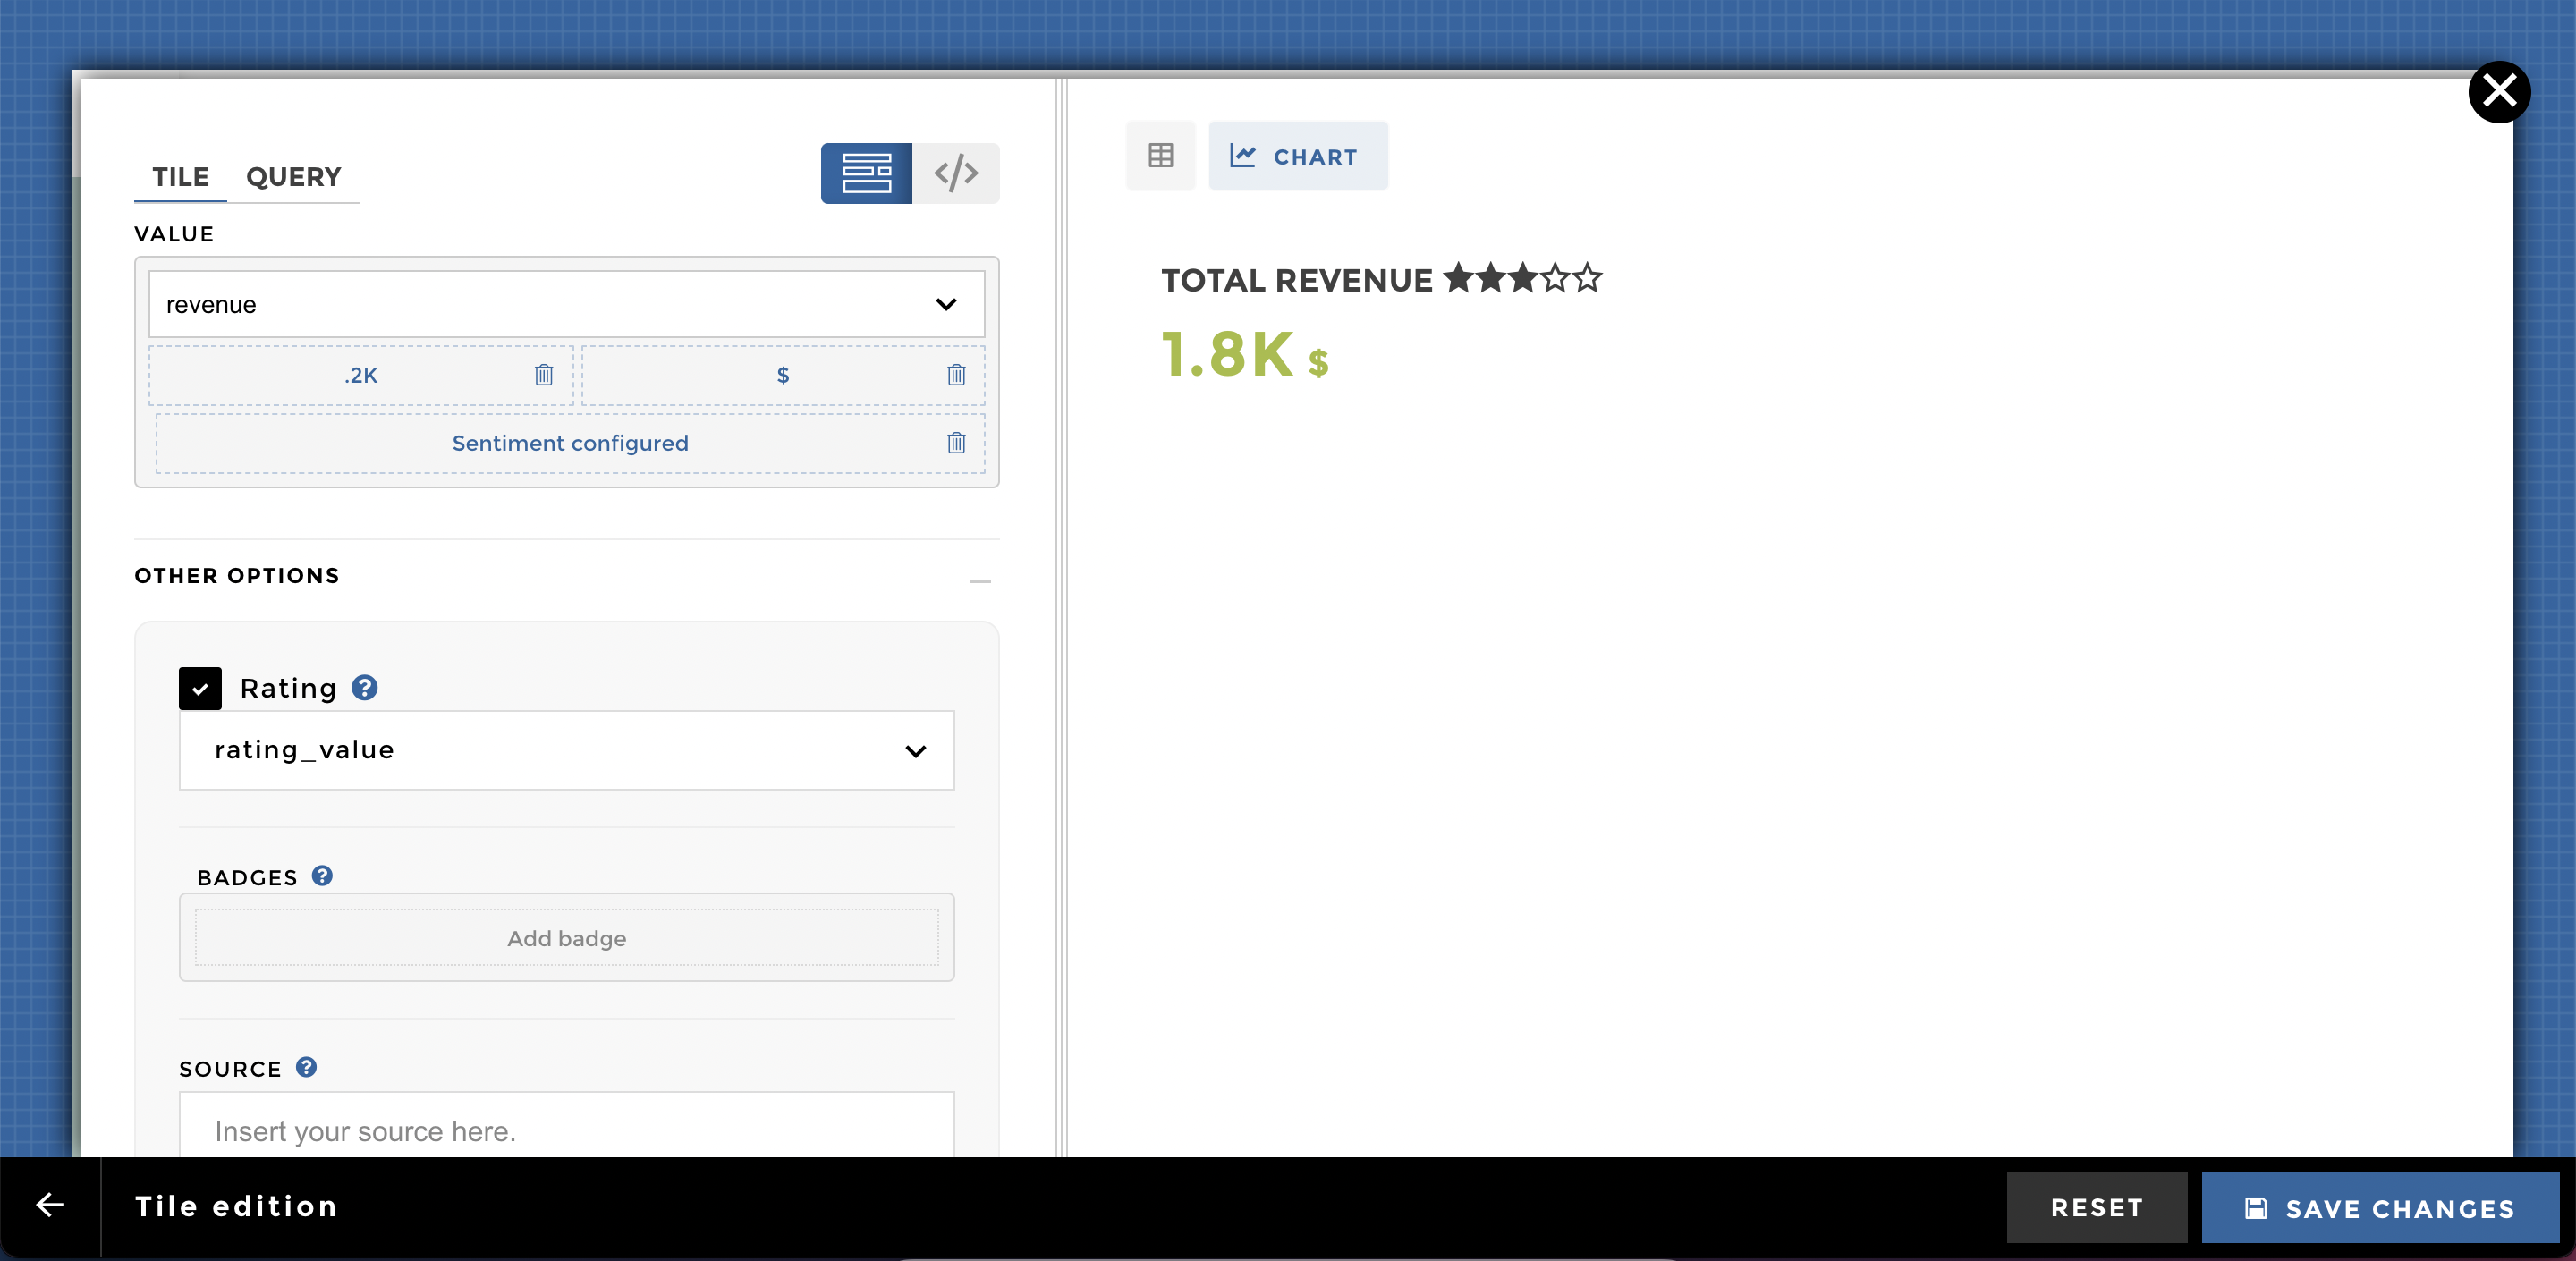
Add star ratings ⭐️⭐️⭐️⭐️⭐️
You can display stars next to the tile title.
Just select a column from your dataset. The rating value must be a float between 0 and 1.
The stars will be completed depending on the value :
- 1 => all five stars will be completed
- 0 => no star will be colored in the title
- 0,5 => 3 stars will be colored in the title
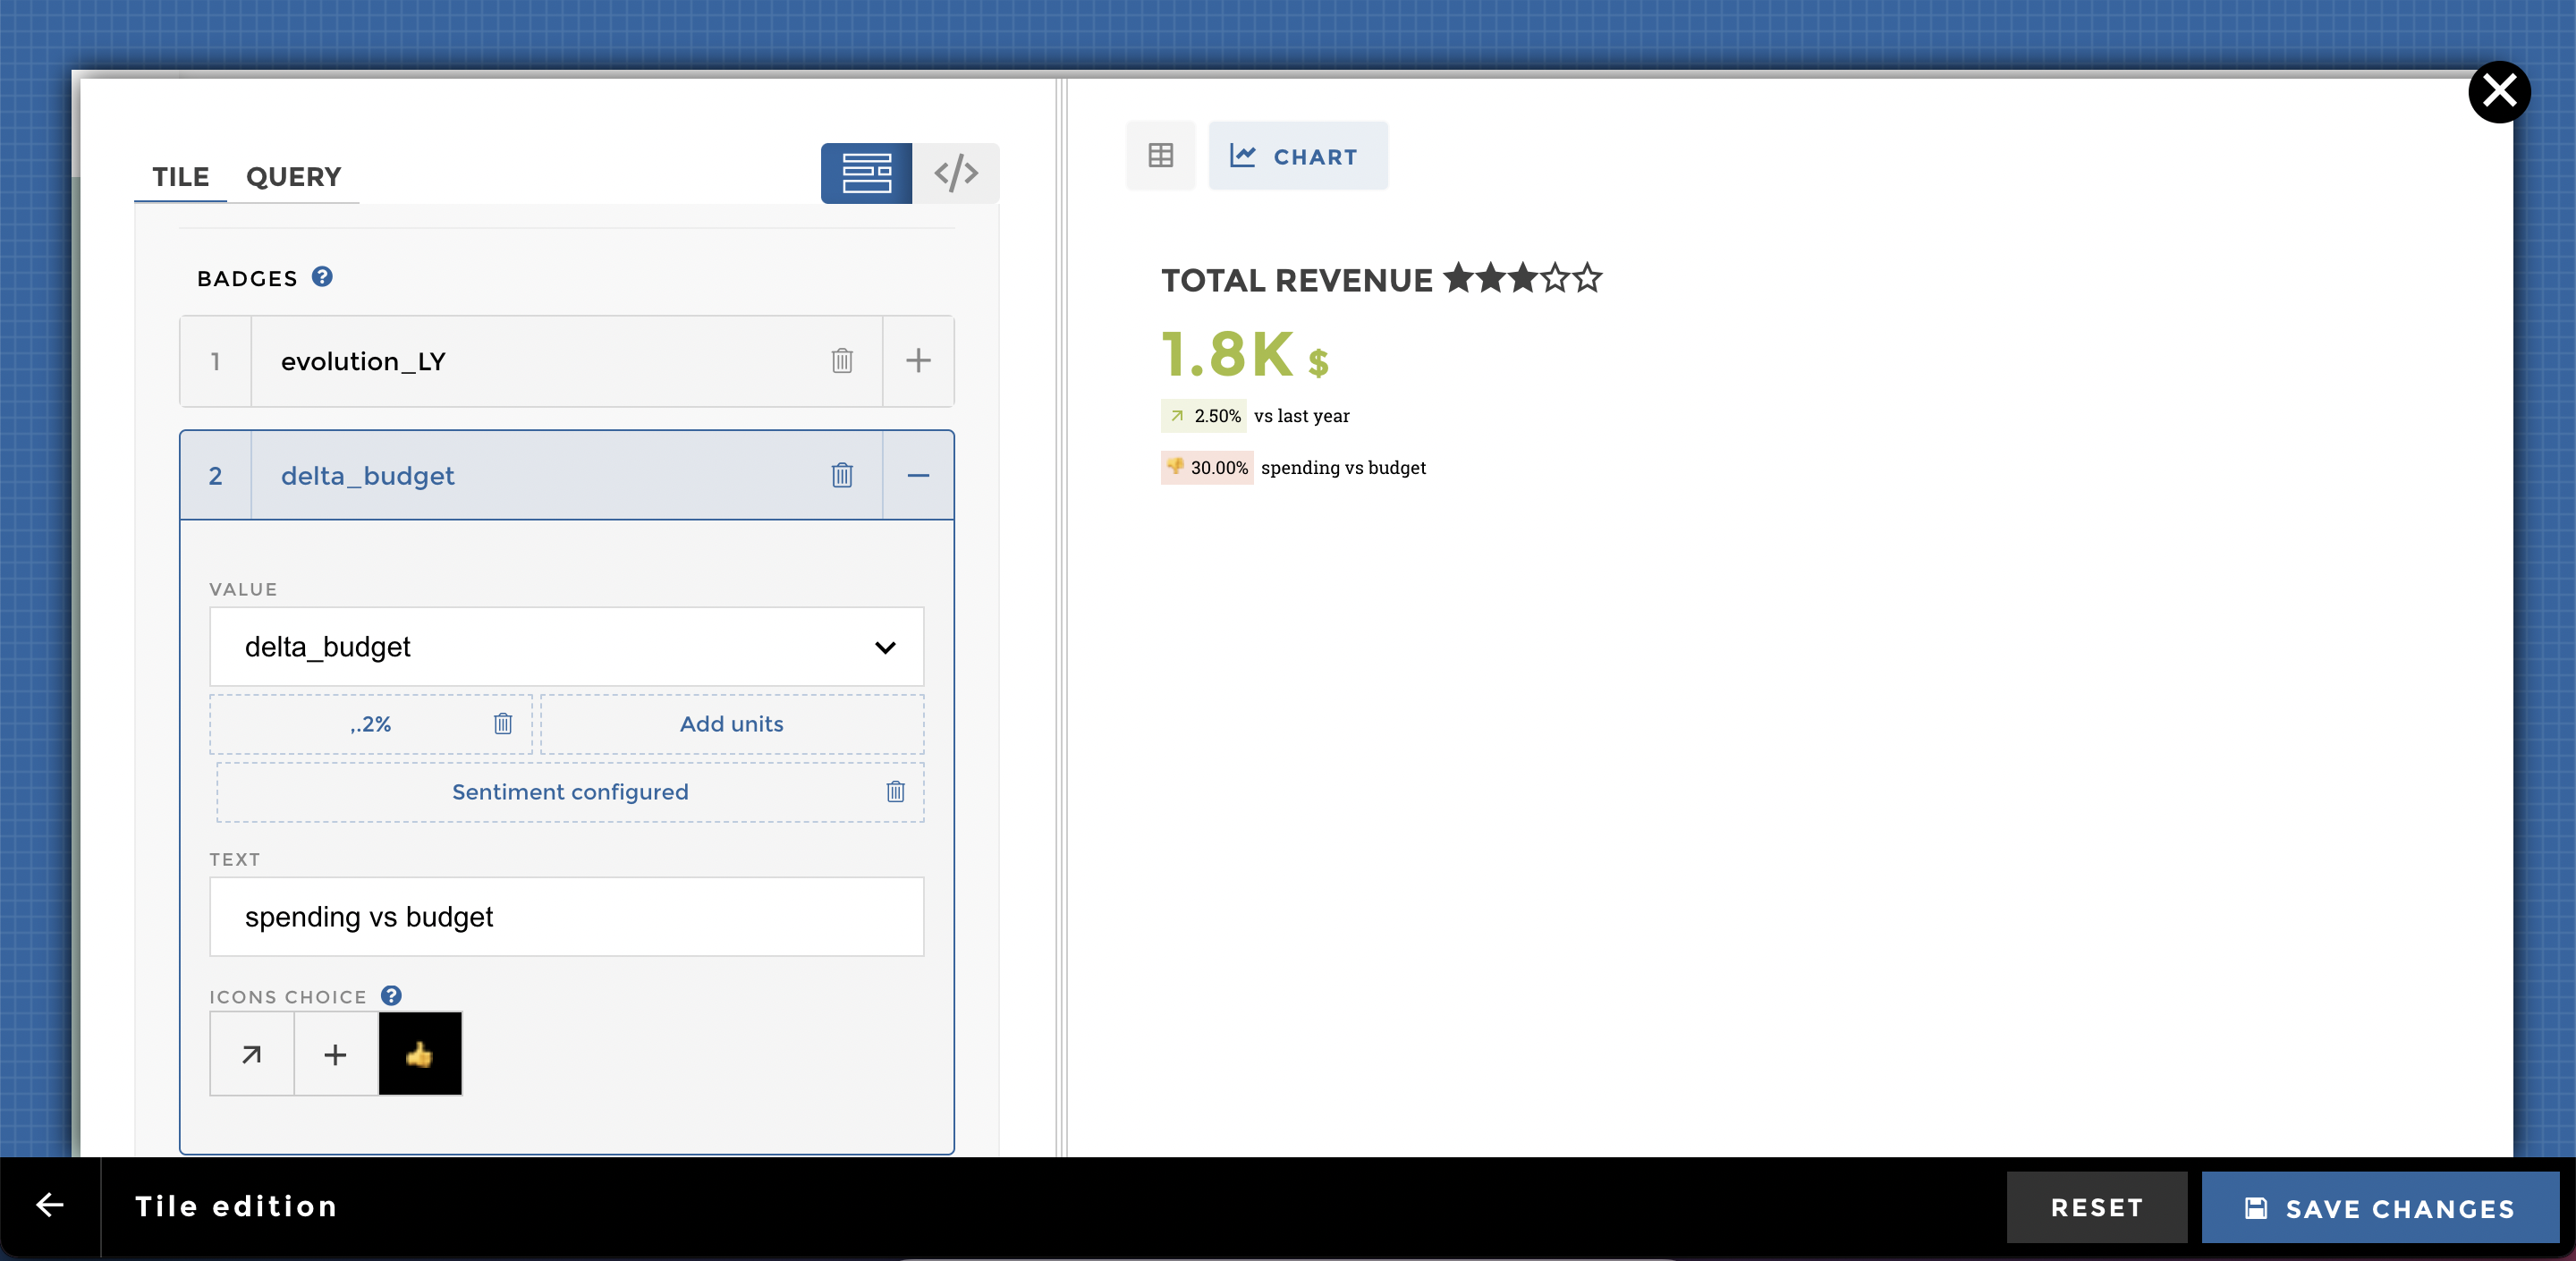
Add badge(s)
You would love to add more contextual information, dynamic or static, under your indicator right ? Or even an icon to indicate the variation of your numbers ?
What’s the evolution of my KPI versus last year ? or budget ?
Guess what !?! It’s possible 🔥 you can add up to 2 badges.
For each badge you can add a value, a text and a color coding.