How to :: Create a Data Model
What’s the point of using a Data Model ?
Creating a data model is the cornerstone of our Design method
The data model is the cornerstone of Toucan method. We use it to make our clients own their data, and ensure the quality of the data displayed inside their apps.
To know more about the many benefits of running your project using a data model, check out our amazing doc about Why :: choosing a data model approach.
Prerequisites
To help your client creating a data model:
- You need someone to talk to : check that there are people in charge of the data in the project team, and make sure to involve them at the very beginning of the project.
- You need someone to work with : check that resources are available for industrialization. These people will be committed to generate data extracts and iterate with you on the data format.
How to get your client ready for your Data Model?
Manage expectations
- What you want as a conceptor 👍 : the data in the most appropriate format to fit the dataset expected by the viz you’ve built in the design phase.
- What you don’t want as a conceptor 👎: deal with extra work integrating the data, by making extra operations to your data (e.g. cleaning, transformation, etc.)
- What your client doesn’t want 👎 : provide too many data tables and spend too much time on generating data extracts
You need to find an in-between :
- Get one data table per story
- Get a unique data table for your entire application
Stay open
Bear in mind that it can be difficult for your client to find its own data, do not offer definitive solutions.
Check with your client :
- How many databases do they have? what’s inside their databases? What does the raw data look like?
- Will they be able to do the calculations we’re asking for? What’s the cost for them to format the data the way we need it?
The question you need to answer at the end is: can you help your client by adapting the data model you’ve provided ? Can you simplify it? Make it easier for them to generate. Keep in mind that your objective is to have data in your app 😁
Also, to help your client filling the data model, explain precisely that it is the result of the app design : the views hierarchy inside your app, the temporality (“current”, “YTD”, “12 rolling months”). Make sure it’s clear that generating these extracts have to be anticipated and ready for go live estimated date, that all (or at least most of) calculations will have to be done on their end.
The 3 steps to build your data model
1st - Define the architecture of your application
What we mean by “architecture” is the backbone of your app. That is to say the different views you get in your application, the hierarchical links between them, and the temporality wanted. You’ll have to model :
- a view referential – your report requester
- a temporal format – your date requester
The view referential
It will depend on the hierarchical structure you have defined in your application. Is it..?
A flat hierarchy : every views are at the same level
📝Brand performances, where each brand represents a view
A simple hierarchy : each view is the “child” of another, which is its “parent”
📝Mall analysis, where each shop represents a view (children), aggregated in shop categories (parents)
A complex hierarchy : a “child” view can have several “parents” that are not necessarily linked between themselves
📝A Real Estate Portfolio, where each asset is a view (child), and belongs both to Territories (parent 1) and Asset Managers (parent 2), which are not hierarchically linked
Depending on the level of hierarchy you have, you’ll adapt the content of your view referential. The more hierarchy you have, the more detailed your referential has to be.
For a simple hierarchy, you’ll have to define
Entity_name : this is the unique label/name for each view Entity_group : this is the group your view belongs to (you can have several entities belonging to a same group) Entity_parent : this is the parent of your view (several views can share the same parent)
📝 Let’s take an example : your application is aiming to track shop performances within a mall, depending on their categories (group), and on which level of the mall they are located (parent).
| Entity_name | Entity_group | Entity_parent |
|---|---|---|
| shop 1 | FMCG | Level 1 |
| shop 2 | FMCG | Level 1 |
| shop 3 | Healthcare | Level 1 |
| shop 4 | FMCG | Level 2 |
| shop 5 | Audio | Level 2 |
For a complex hierarchy, you’ll have to define
The same columns as above : Entity_name, Entity_group, Entity_parent Parent_group : this is the group your parent belong to (several parents can belongs to the same group)
📝 Example : you follow your real estate portfolio, by asset, which belongs to different Asset Manager, Territory, Direction and Company. You have a double hierarchy :
- Asset > Asset Manager > Direction > Company
- Asset > Territory > Direction > Company
| Entity_name | Entity_group | Entity_parent | Parent_group |
|---|---|---|---|
| asset 1 | Asset | LLC | Company |
| asset 1 | Asset | Area-51 | Direction |
| asset 1 | Asset | Block-12 | Territory |
| asset 1 | Asset |
|
Asset Manager |
| Block-12 | Territory | Area-51 | Direction |
|
Asset Manager | Area-51 | Direction |
The temporal format
Simple temporality
Complex temporality
Usually, you want to analyze your data through different temporalities.
First, you can have different period types : YTD or Current Period for example
Then, you can get different date types : Quarter, Month, Day, Week for example
After setting this up, you can pick a specific date you want to look at : Q3, April, 22nd of May 2019, or Week 35
📝For example, check the date requester on top of the dashboard : you can set up a period type and an associated period.
What you want to get in your data is :
- A date column - which should contain the first day of the associated period (to order your date easily, don’t forget to format it as YYYY/MM/DD)
- A date type column - where you get the detailed type of the date you’re looking at (day, week, month, quarter, year, etc)
- A date label - the date that will be displayed on the screen, it must be readable and user friendly (timestamp format like the following can be hard to read for final users! aaaa-MM-jjTHH:mm:ss. SSSZ)
- A period type column - where you get the detailed type of the period (YTD, MTD, Current, etc)
It will look like :
| Date | Date_label | Date_type | Date_label | Period_type |
|---|---|---|---|---|
| 2018/03/01 | 1st of March | Week | W18 | Current |
| 2018/03/01 | 1st of March | Week | W18 | To Date |
| 2018/03/01 | 1st of March | Month | March | Current |
| 2018/03/01 | 1st of March | Month | March | To Date |
| 2018/03/30 | 30th of March | Quarter | Q1 | Current |
| 2018/03/30 | 30th of March | Quarter | Q1 | To Date |
2nd - Factorize your datasets
One golden rule : Always start from the design of your app
1st : make a list
How? List, story by story, the following elements:
- KPIs / metrics
- Dimensions / breakdown
- Evolutions
- What you see for which View
- What you see for which Temporality
2nd : factorize
Once every KPIs are listed, try to group them. They can get a common structure/way to be read.
📝For example, your KPIs “Operating Income”
- are made of different categories : submetrics, “Rent” and “Service charges”
- have the same reading keys : value_type, “Actual” and “Budget”
- are analyzed on the same period of time : period_type, “Current” and “To Date” Conclusion : You can put them in ONE unique dataset, as below :
| KPI | submetrics | value_type | period_type | value |
|---|---|---|---|---|
| Operating Income | Rent | Actual | Current | 1 |
| Operating Income | Rent | Actual | To Date | 3 |
| Operating Income | Rent | Budget | Current | 2 |
| Operating Income | Rent | Budget | To Date | 1 |
| Operating Income | Service charges | Actual | Current | 7 |
| Operating Income | Service charges | Actual | To Date | 9 |
| Operating Income | Service charges | Budget | Current | 5 |
| Operating Income | Service charges | Budget | To Date | 1 |
3rd - Make your data model understandable
To build a powerful data model, you need it to be a 100% understandable by the team/people that will use it. To do so, make sure to include :
- An exhaustive summary, teasing its content with words :)
- The data formatting best practices, that your client can follow when generating extracts
Include an amazing summary
That’s the front page of your data model. It should be crystal clear at one glance. This is where you list:
- The name of each dataset included inside the DM
- The name of each column of each dataset
- The type of value expected by each column (string, float, date, etc)
- The value expected in these columns (for example name of fixed categories, submetrics, period_type)
- The associated stories (name and ID) so your client can link a dataset to what’s actually designed in the application
- A comment field, to detail as much as possible what’s expected in a column, the calculation rules to apply if relevant, etc
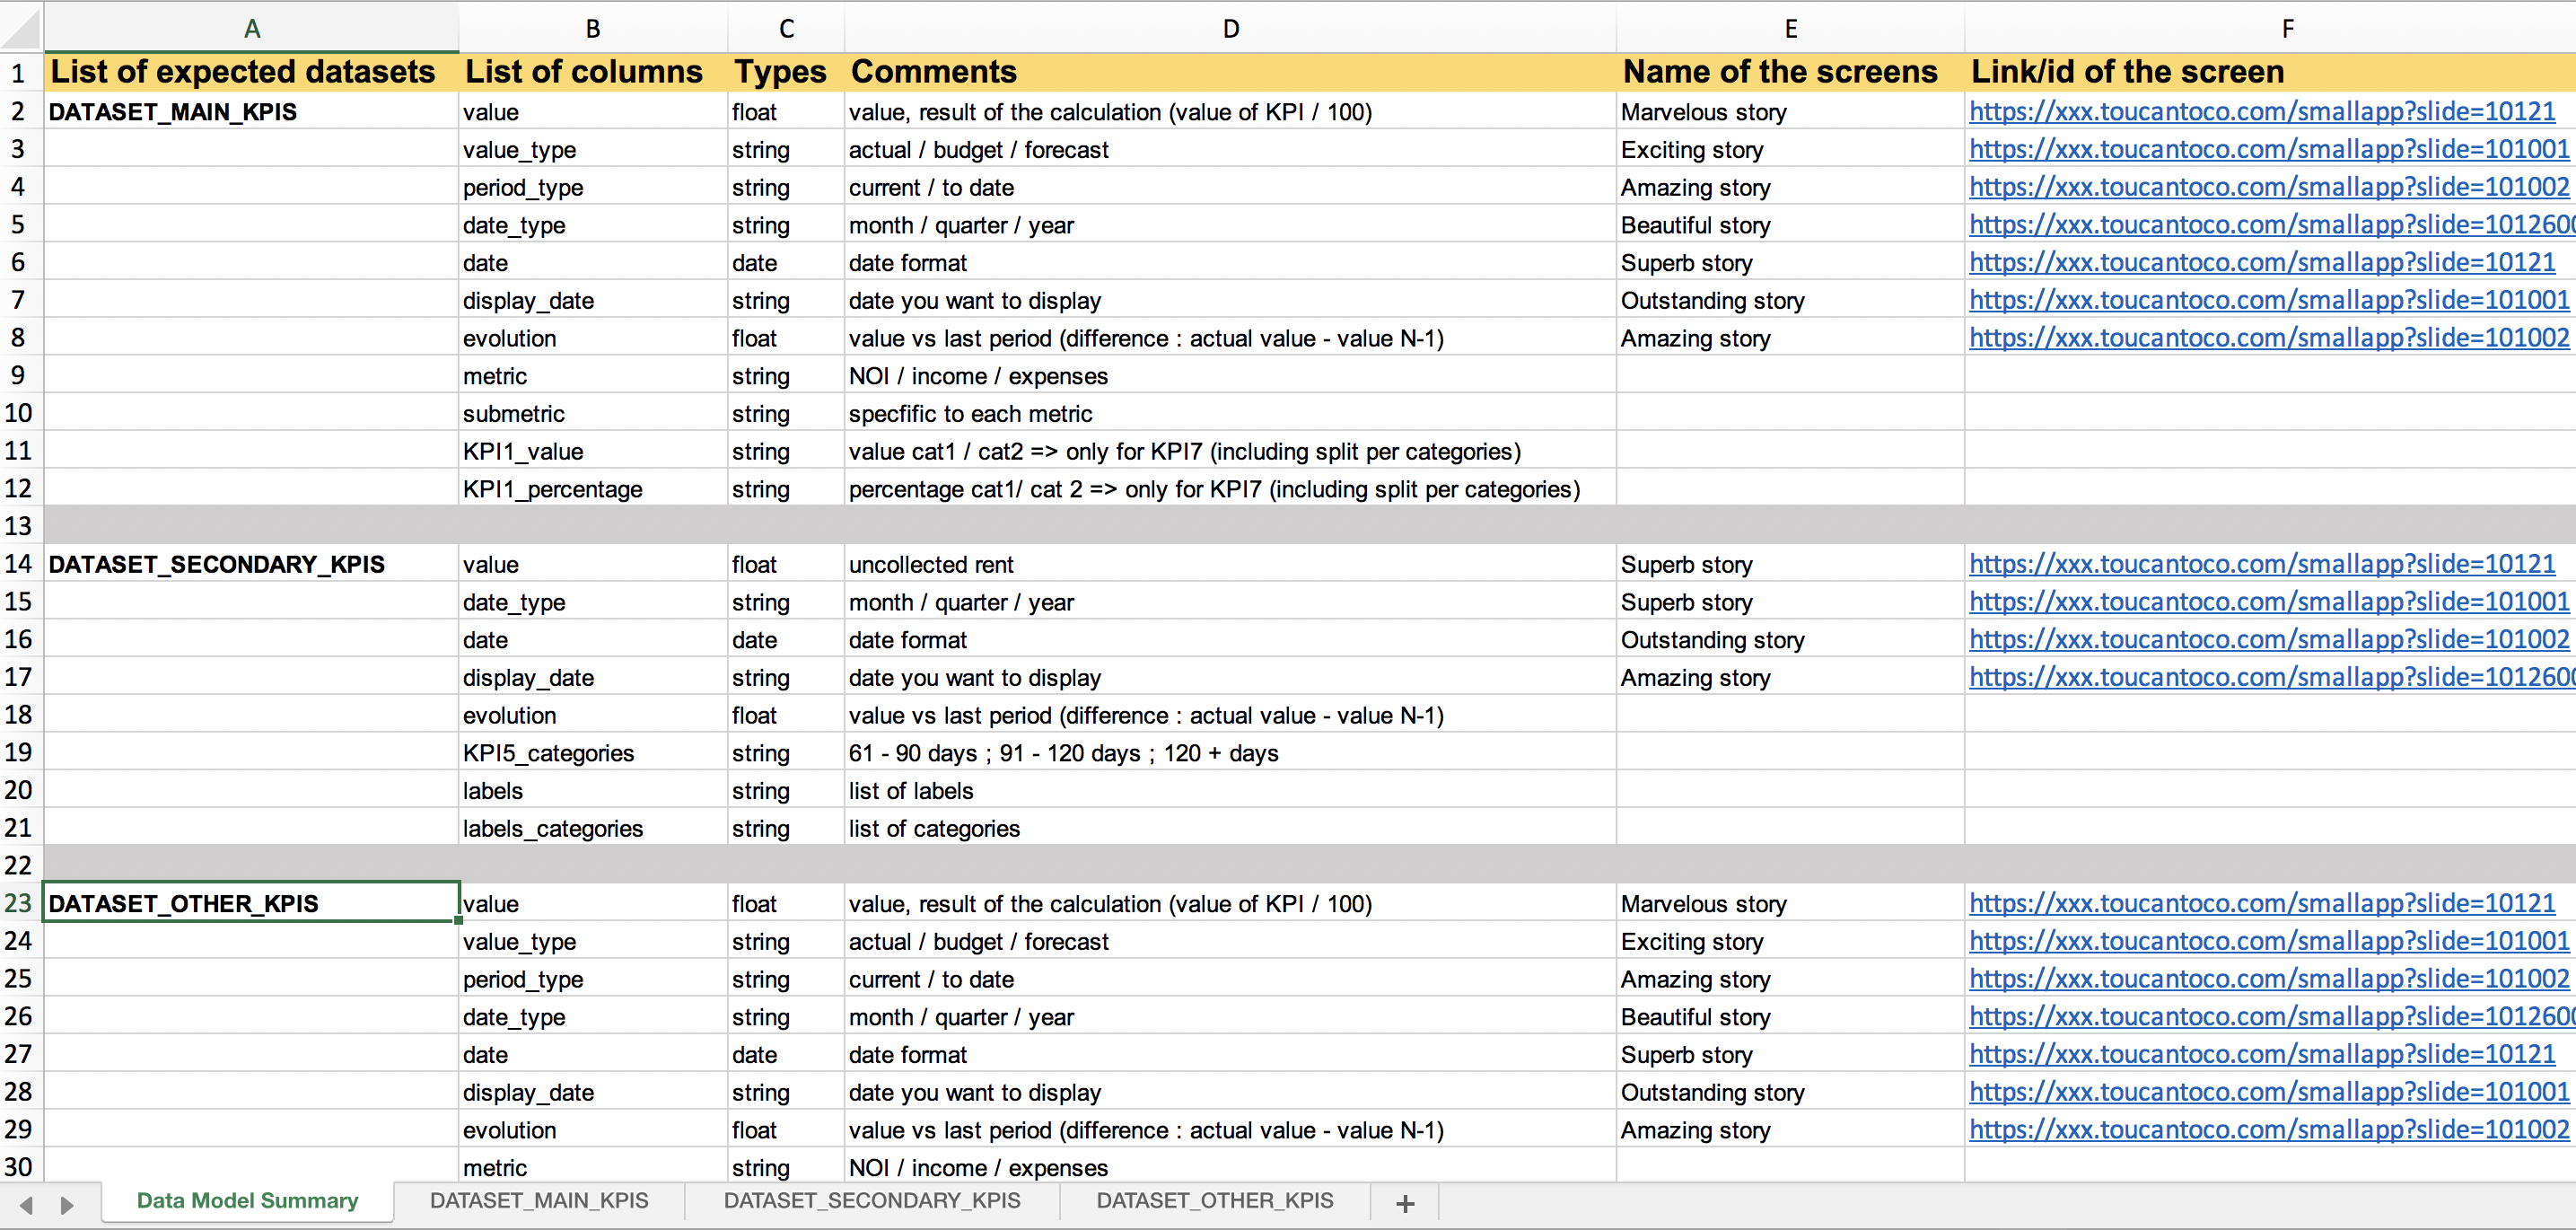
Data Model
Let your client know about the data formatting best practices
Plan a call with your data interlocutor, to remind her/him that:
- The name of the column has to be meaningful : we should rather have a column named “evolution” instead of “value_2”
- The name of the column shouldn’t contain any space, special characters, accent : use “value_type” instead of “value type”
- Apply the same naming convention to all the datasets so it makes sense globally
- Precise how the
nullvalue should be displayed (“n.a.”, “N/A”, “null”…) - Do not skip lines inside your datasets
- Use one excel tab per dataset