How to :: Build a Story
Design a story
To build a story, we need to focus on two things:
Understand the users’ need
Start by answering to these three questions about the user:
- Who ? Describe the final user’s profile
- Job: Top Manager, Executive, Salesperson…
- Catchment zone: Geographic area concerned…
- Why ? Describe the final user’s need.
- For what ? Describe the action the final user would take from those data. And finally, write down the question that the story will answer (a kind of problematic :)), this will help you stay focused on the users’ need.
Note
Try using the narrative to write down your user story. What problem are you solving with this story?
Choose the good chart
Data visualization is to communicate numbers or raw information by transforming them into visual objects: dots, bars, lines, maps… Combining simple functionalities and design, data visualization saves a lot of time in searching and analyzing data.
It’s also a very powerful communication tool.
Just keep in mind the good viz is the one helping you answer a clear question for your organization.
💡 Remember the #1 rule : a viz = a message 💡
Which kpis do you want to represent ?
Should I compare or switch between metrics ? Should I compare my value to another (objective, last month, comparable…) ?
At which frequency, time, periodicity do you want to display the figures ?
Am I willing to represent an evolution or a static value ?
Are they going to use the app on mobile ?
Tip
💡 To help you choose the good chart, take a look to our viz gallery
Don’t hesitate to fill this canvass to help you finding the good story !
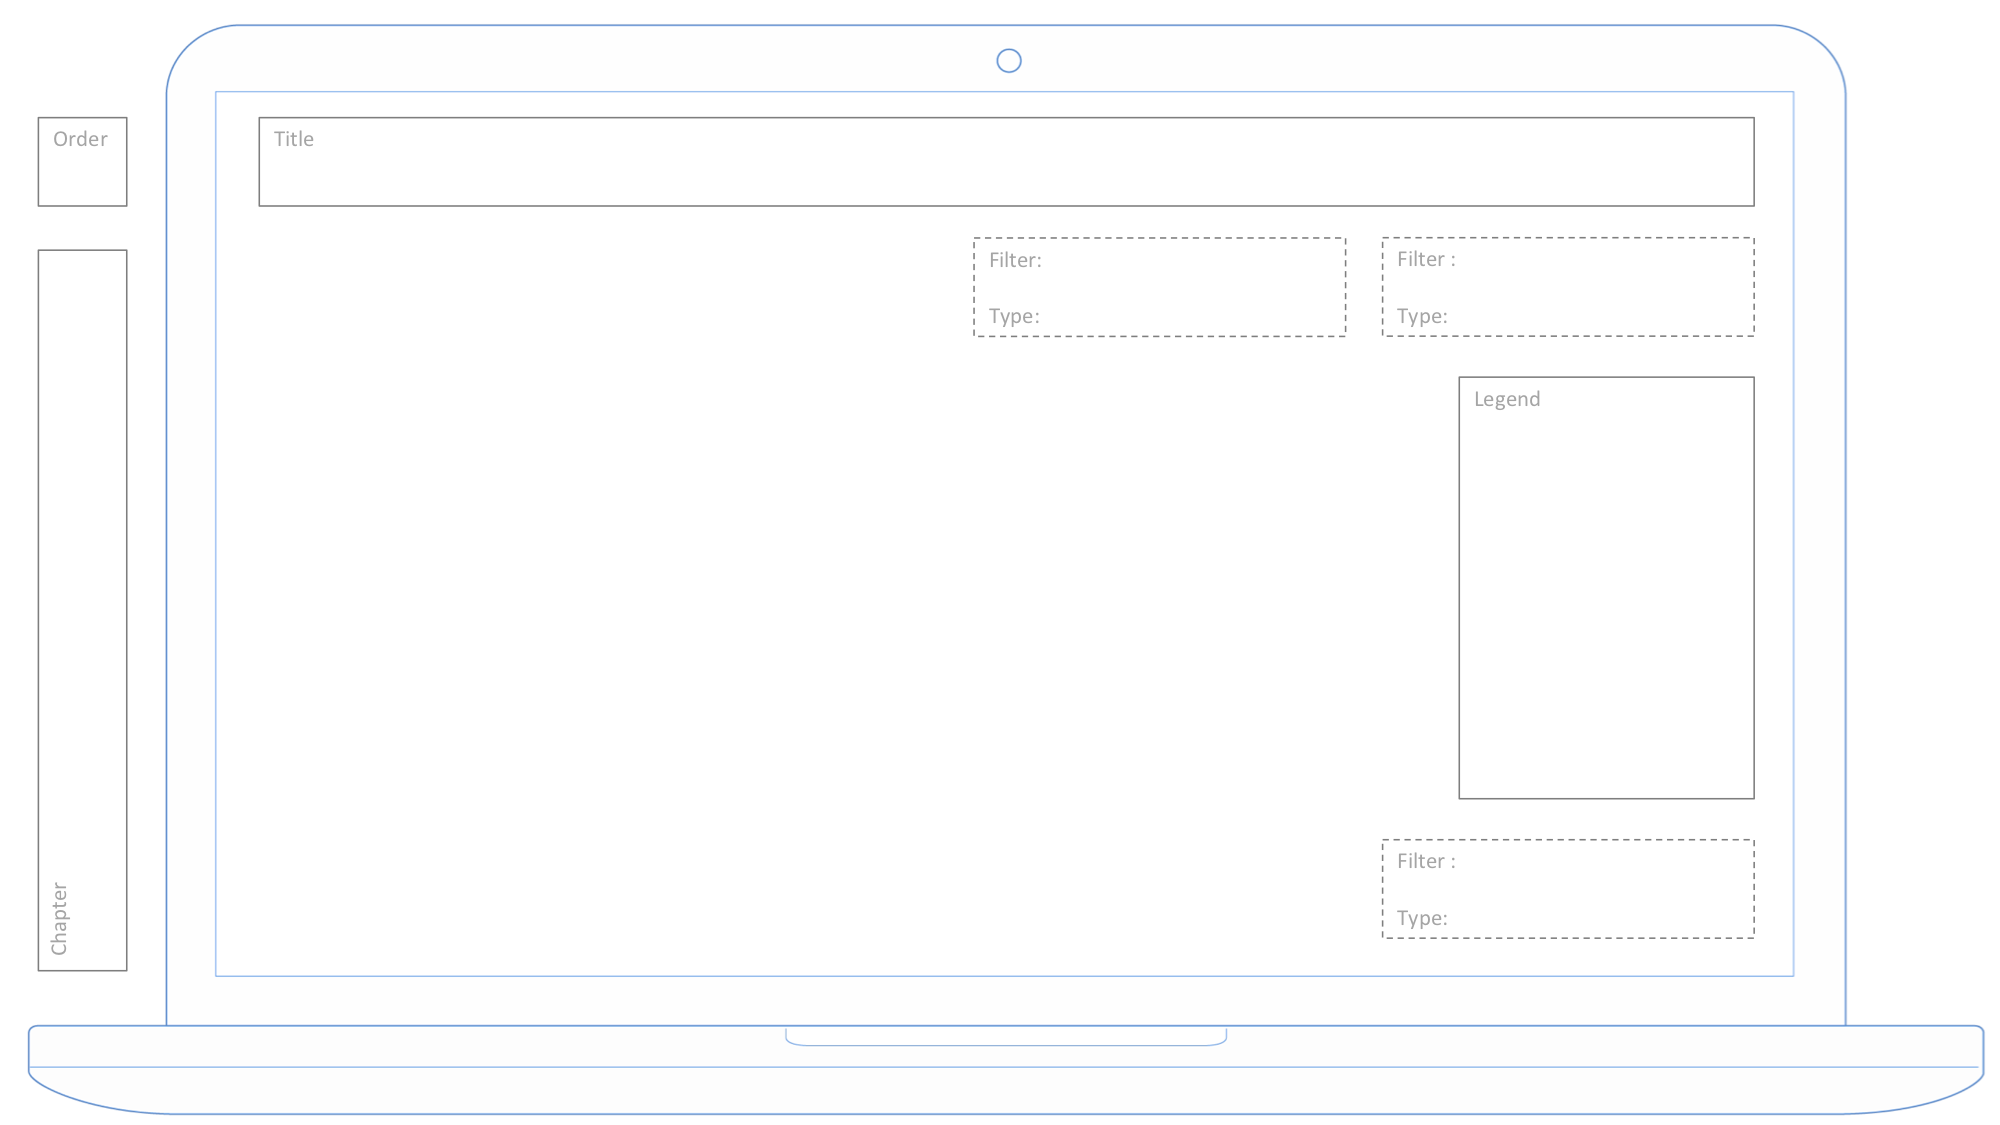
Canvass