Aggregate in YouPrep™
Overview
When you are building your story, you might not have the values at the visualization level you need: if you have your data aggregated at a city level, you might want to visualize them at a country level. You will then need to aggregate them. Thanks to the aggregate widget, you can apply the following operations to your dataset:
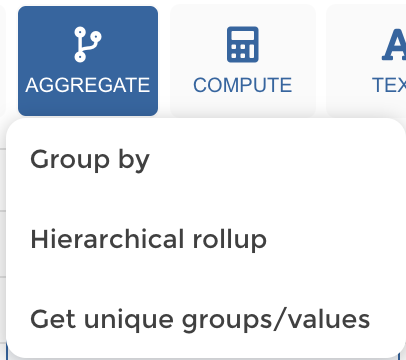
- Group By
- Hierarchical roll-up
- Get unique Groups/value
Examples
Warning
Before you start!
My dataset is containing my turnover per Quarter for each year.
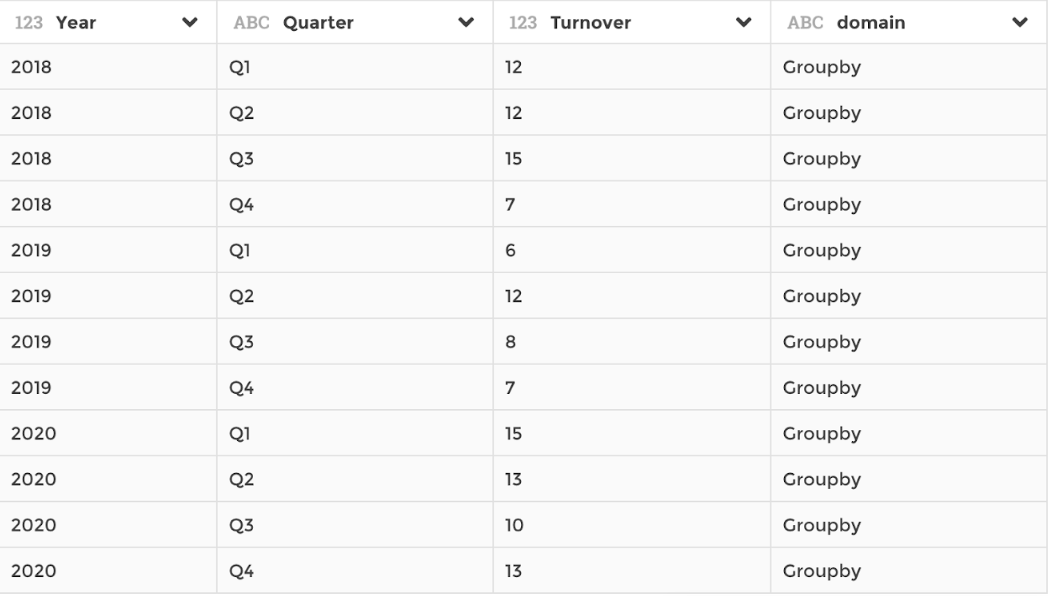
dataset
I want to display the evolution of my turnover per year. I need to group all my values per year using the Aggregate step : Group By operation:
- Group by allows you to perform different types of operation on your KPIs : you can sum them up or get their average for example !
Your YouPrep™ step should look like this: 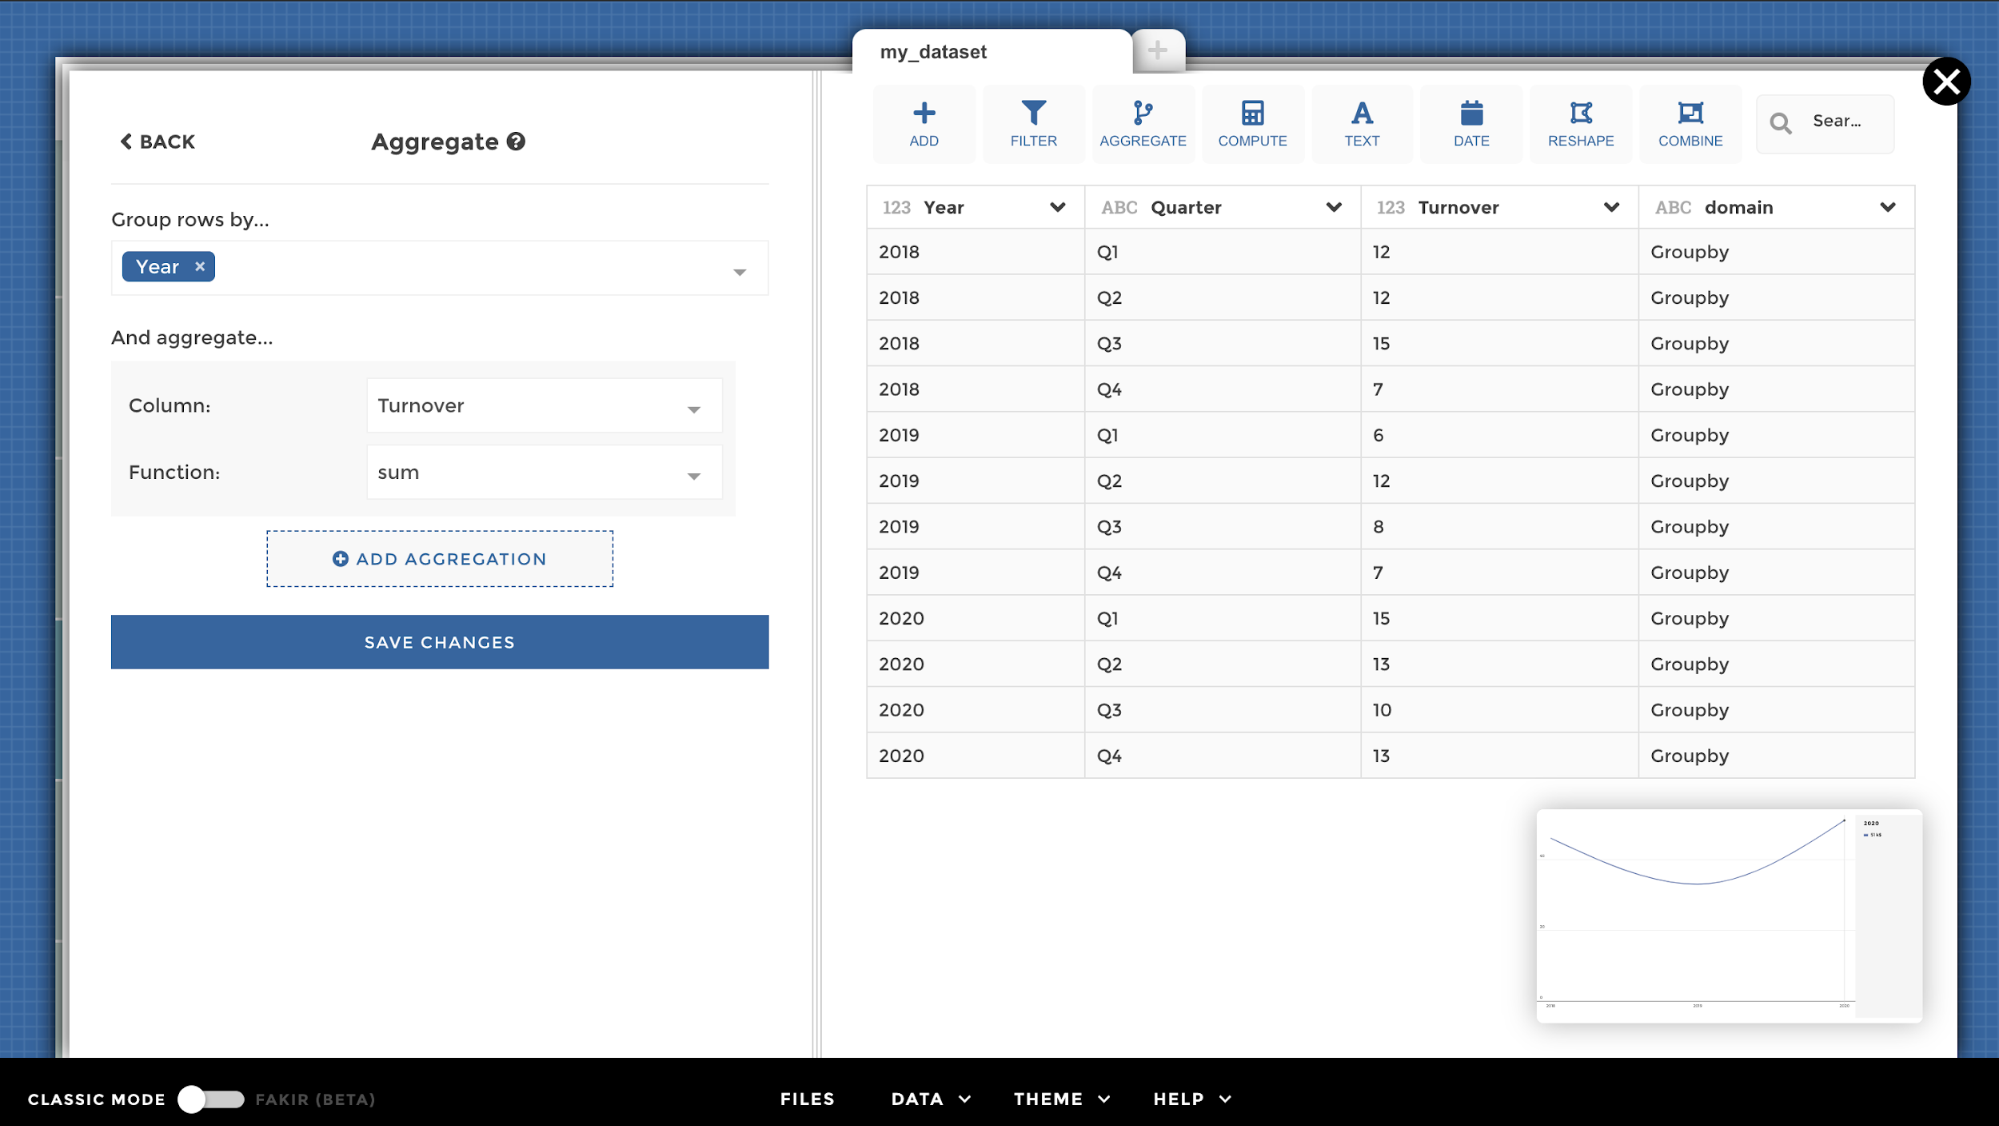
Here you go ;)
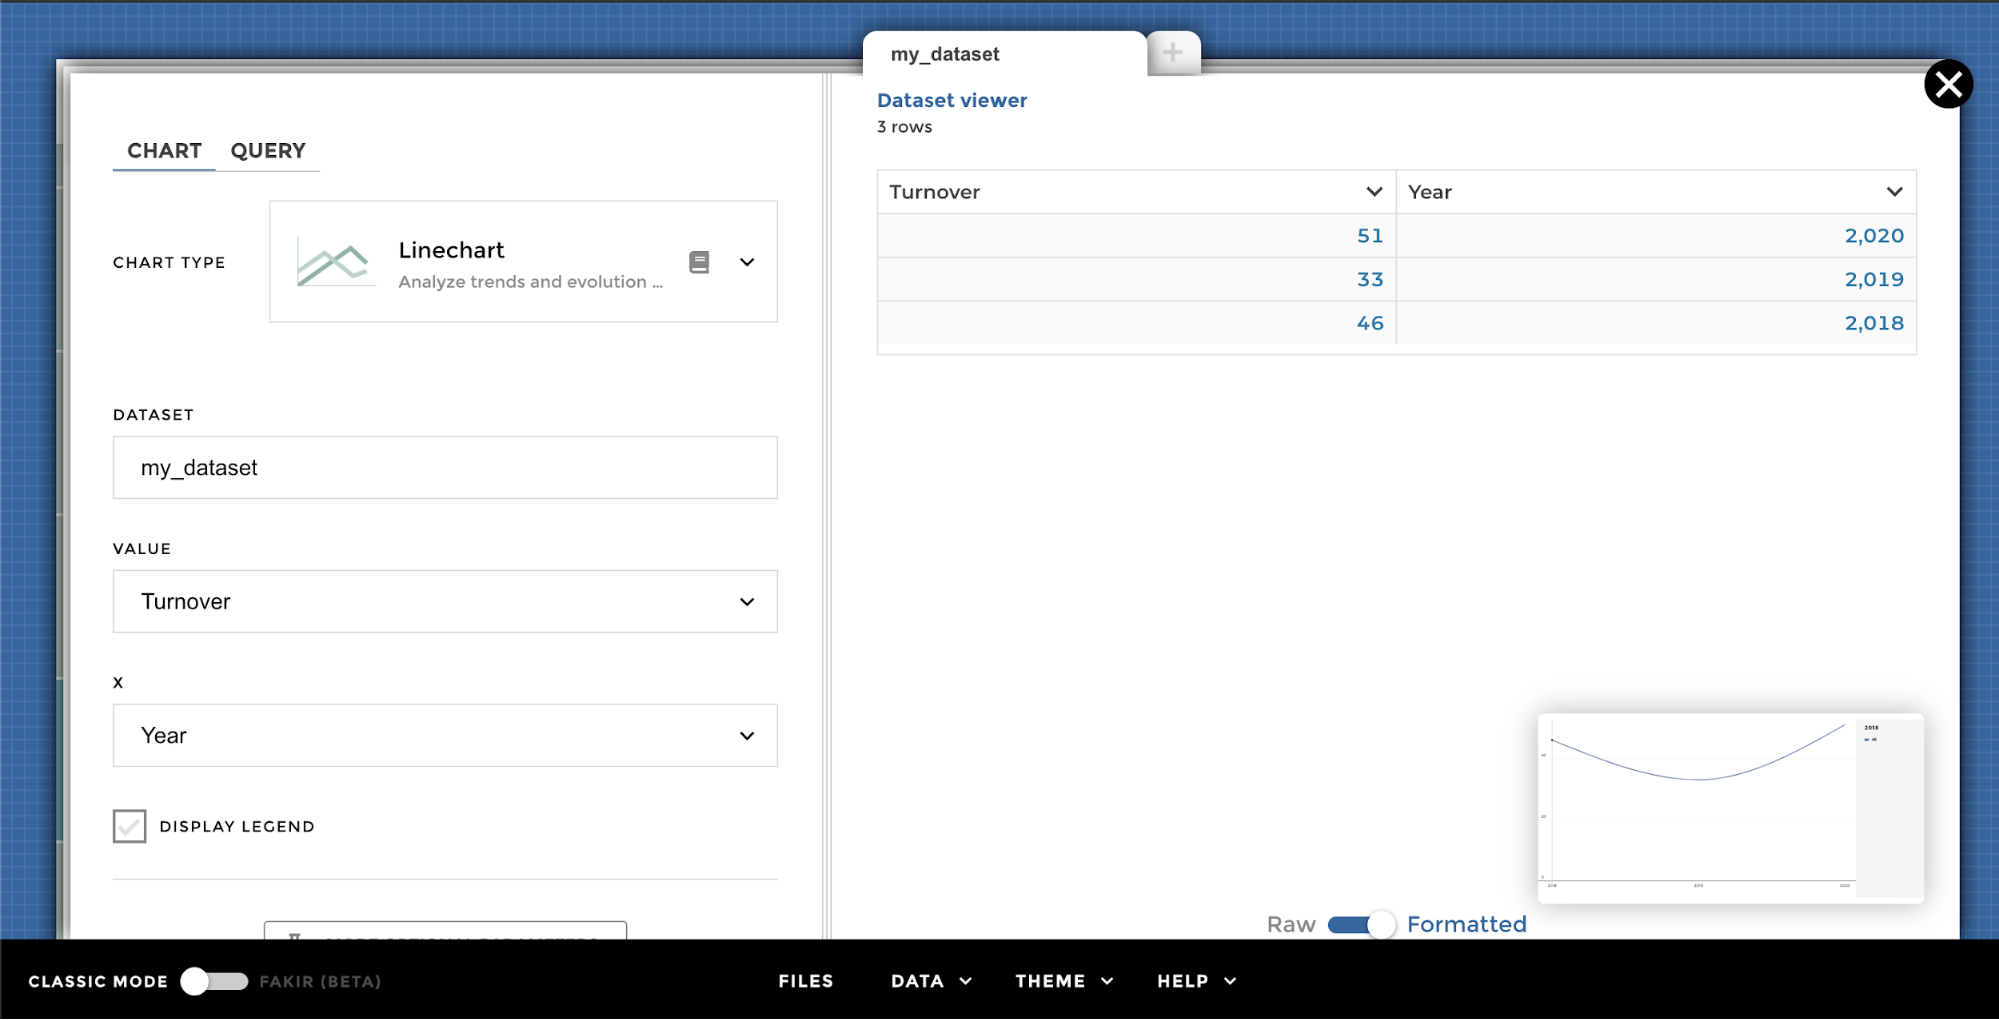
YouPrep step
My data might only contains data at the lowest level. The hierarchical rollup operation will allow you to aggregate data at each hierarchical level and stack the aggregated data of every level, based on hierarchical columns (e.g. city < subcountry < counrtry ). This step is really helpful to give your dataset a hierarchical structure that Toucan could interpret properly for its charts (ex leaderboard drill, waterfall drill… or even hierarchical view selector).
📝 Perfect operation to set a hierarchy with only the children value.
Before you start! You will often have to display various levels of aggregations on your screens. For ewample, my dataset contains the main cities worldwide. We can find different level: names of the city, subcountry and country. Thanks to the hierarchical rollup operation, we are going to create a hierarchy between these three columns.

I would like to have the number of main cities by subcountries and countries. By adding a hierarchical rollup step, the output data structure stacks the data of every level of the hierarchy, specifying for every row the label, level and parent in dedicated columns.
Your YouPrep step should look like this:

Now I can add a filter to be able to have the ranking of the main city at the three levels:
- Ranking of the countries containing the most “main cities”
- Ranking of the sub countries containing the most “main cities”
- Ranking of the main cities

📝 You can use this step to get the unique values from a column or unique groups of values from a combination of several columns.
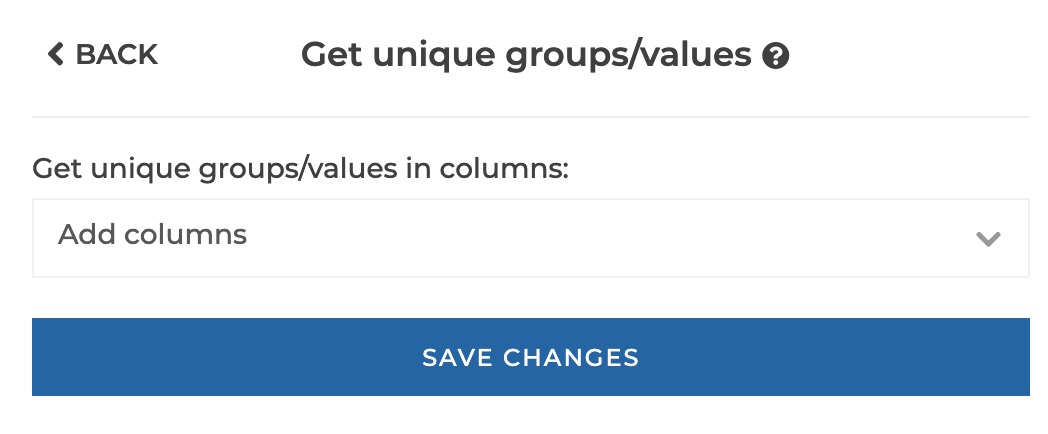
get unique1
Get unique groups/values in columns: you can select one or several columns that will be combined to constitute unique groups of values.
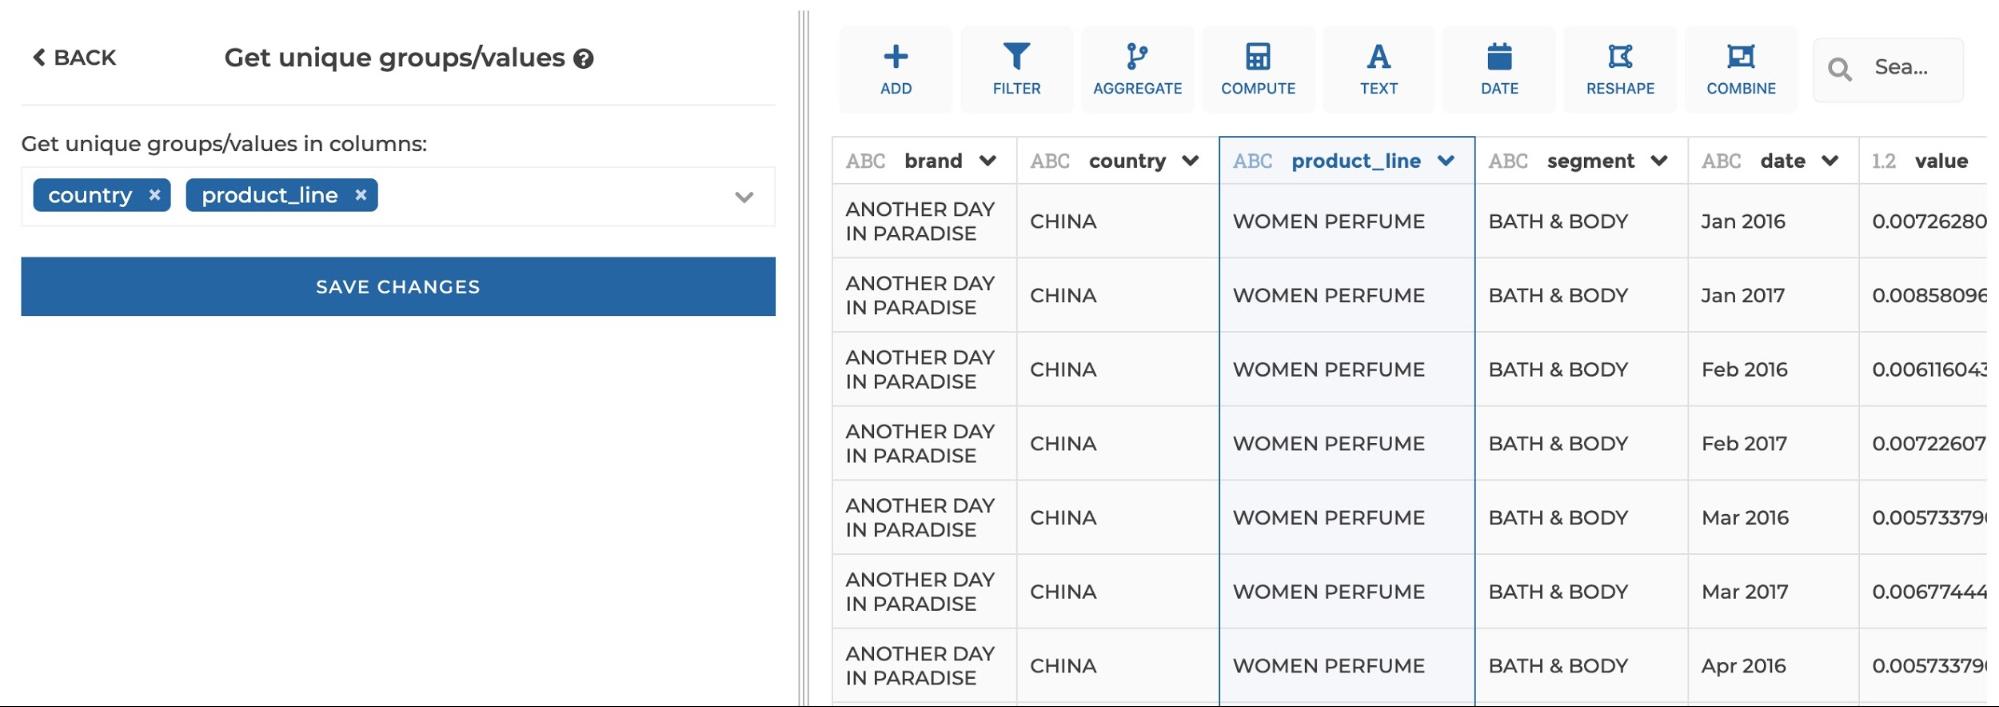
get unique2
Tadaaaa 🎉
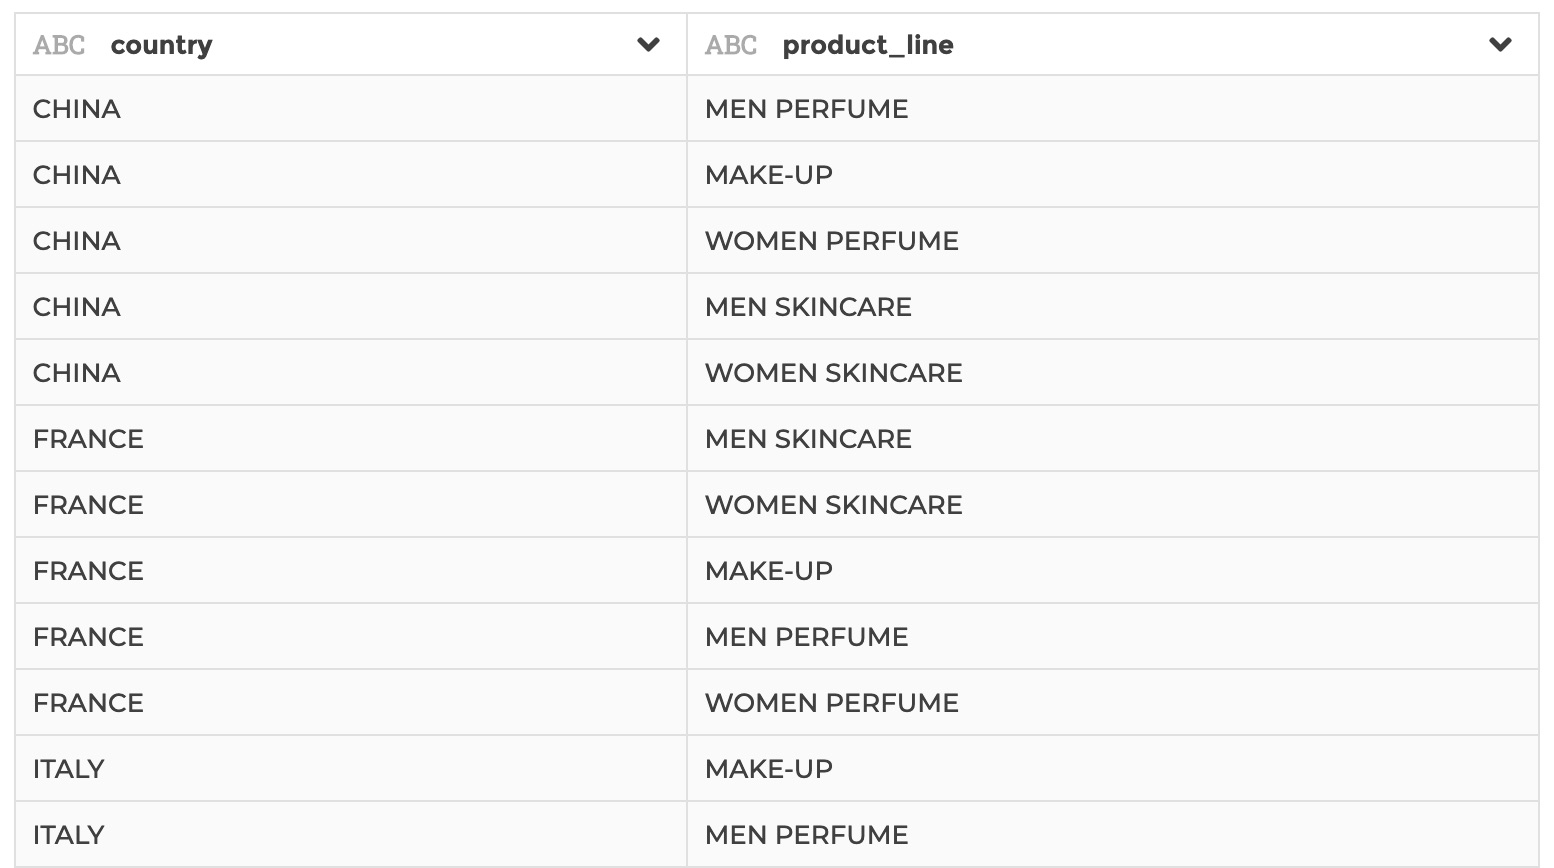
get unique3
Do not hesitate to read the weaverbird documentation if you need any further informations on YouPrep!