How to :: troubleshoot the toucan way?
Do you have a config problem or a data problem ?
There are three main reasons why you might not see what you’re expecting to:
- The data query that is used doesn’t return the right rows
- The config options are not well set
- You’re not looking a the right state of the application
What do you mean by “looking at the right state of the application” ?
Here are the actions that you should check:
- Are you looking the right environment staging vs production. When working on the app you should always be in the staging environment.
- Did you click on “release to production” to see the changes you’ve made in staging ?
- You uploaded a new etl_config with changes in the DATA_SOURCES array but did you relaunch a populate on the data ?
- You uploaded a new etl_config with changes in the REPORTS array or new reports templates but did you relaunch a populate on the reports ?
- You uploaded a new etl_config with changes in the DAHBOARDS array or new dashboards templates but did you relaunch a populate on the dashboards ?
The Chrome Dev Tools will be use extensively to debug the app, so we recommend you to read the documentation on how to use it.
How to track a config problem ?
A config problem is harder to spot. You’ll use the Chrome Developper Tools too to Inspect the logs of the application or the report / dashboard / config returned by the back end.
First thing is to open the Chrome Dev Tools with: Right click -> Inspect
Here are classic config problems:
- Generic problems
- Did you specify an id, parent_id for my slide ?
- Indentation is correct ? Use js2coffee and an online JSON editor to be sure your blocks are in the right spot
- Did you respect the case when setting the columns in the
label,value,groupsetc. entries ? eg.Value != value. - Does your chartType is valid ?
- Regarding precision, units and sentiment
- If you have trouble with precisions, units or sentiment recheck the documentation you might not have set the correct column name in your config.
- For precision it has to be in the
datablock whereas the sentiment and units are in thechartOptions - For precision refer to this documentation to check you have a correct syntax
- Regarding crossfilter
- If you are configuring a double charts (crossfilter), did you specify
id: 0andid:1for the charts ? - If you crossfilter haven’t you forget the
datasets:[1]entry ? - If you crossfilter on a date do you treat the date the same way on
both charts ? eg. Either both or none should have a
date: {selector:'', format: ''}block in the data query
- Dealing with time
- If you want to configure a linechart, barlinechart or stackbarchart
that includes a date be sure that you included the
date: {selector:'',format:''}in youdatablock
Inspect the current report
Click on the Network tab to display all the requests made by the
application. If you opened the dev tools after the requests has been
made You’ll have to reload your app to capture the requests so press
Refresh
You’ll look for the request formatted like
https://api-XXXX.toucantoco.com/SMALL_APP_ID/reports/REPORT_ID
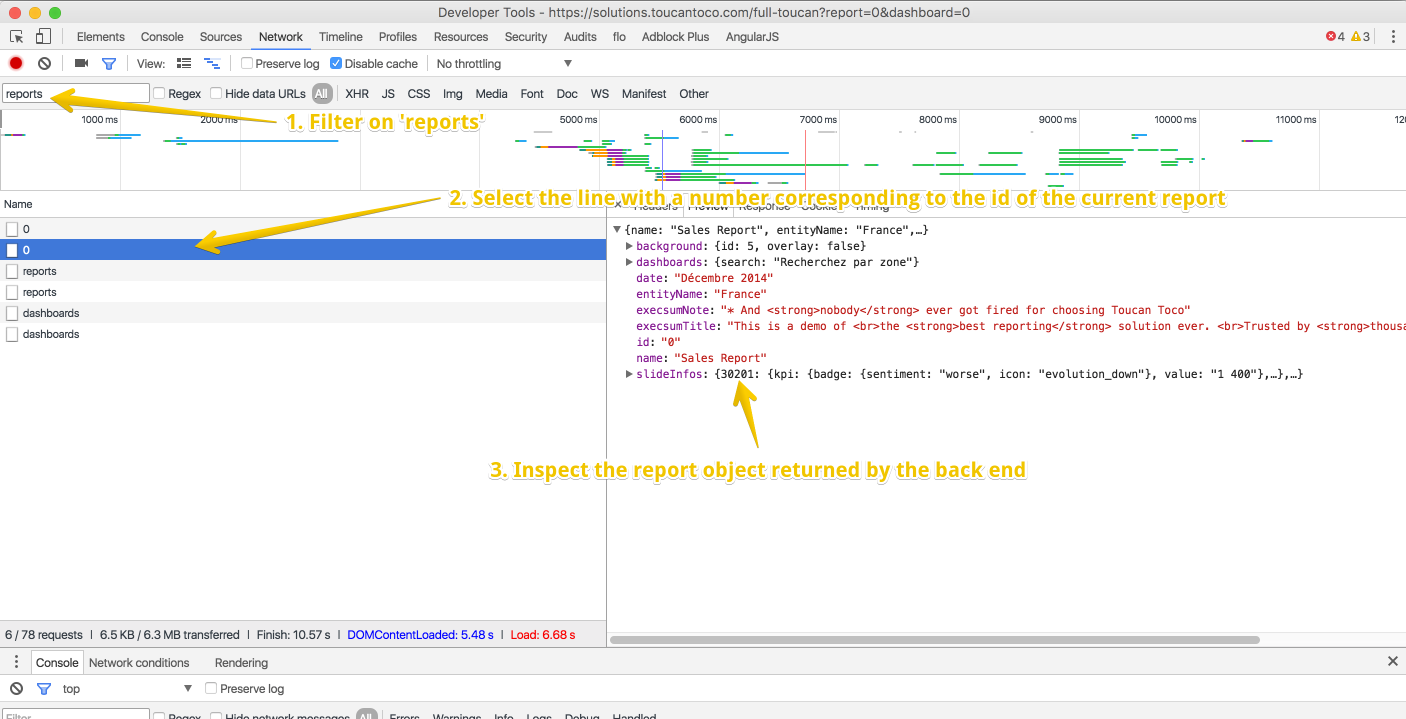
Devtools report
The object you’ll inspect will correspond to the template report after it has been populated with the data you specified in the etl_config.
Inspect the dashboards
Like with the report click on the Network tab to display all the
requests made by the application. If you opened the dev tools after
the requests has been made You’ll have to reload your app to capture the
requests so press Refresh
The request formatted like
https://api-XXXX.toucantoco.com/SMALL_APP_ID/reports/REPORT_ID/dashboards
will list you all the available dashboards for the current report.
The request formatted like
https://api-XXXX.toucantoco.com/SMALL_APP_ID/reports/REPORT_ID/dashboards/DASHBOARD_ID
will show you the current dashboard.
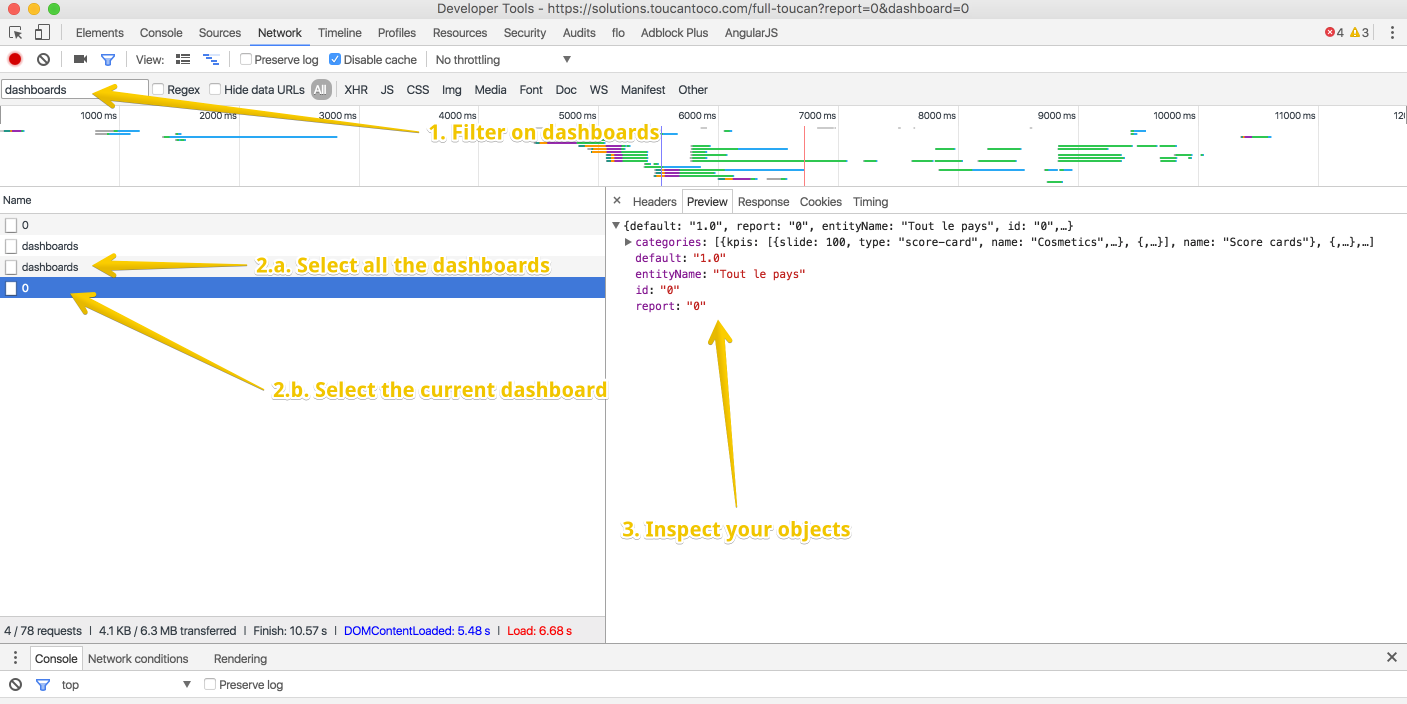
Devtools dashboard
Inspect the logs
Click on the Console tab to display all the logs captured by the
application. The application might warn you when an option is not well
set, a request failed, or something looks broken.
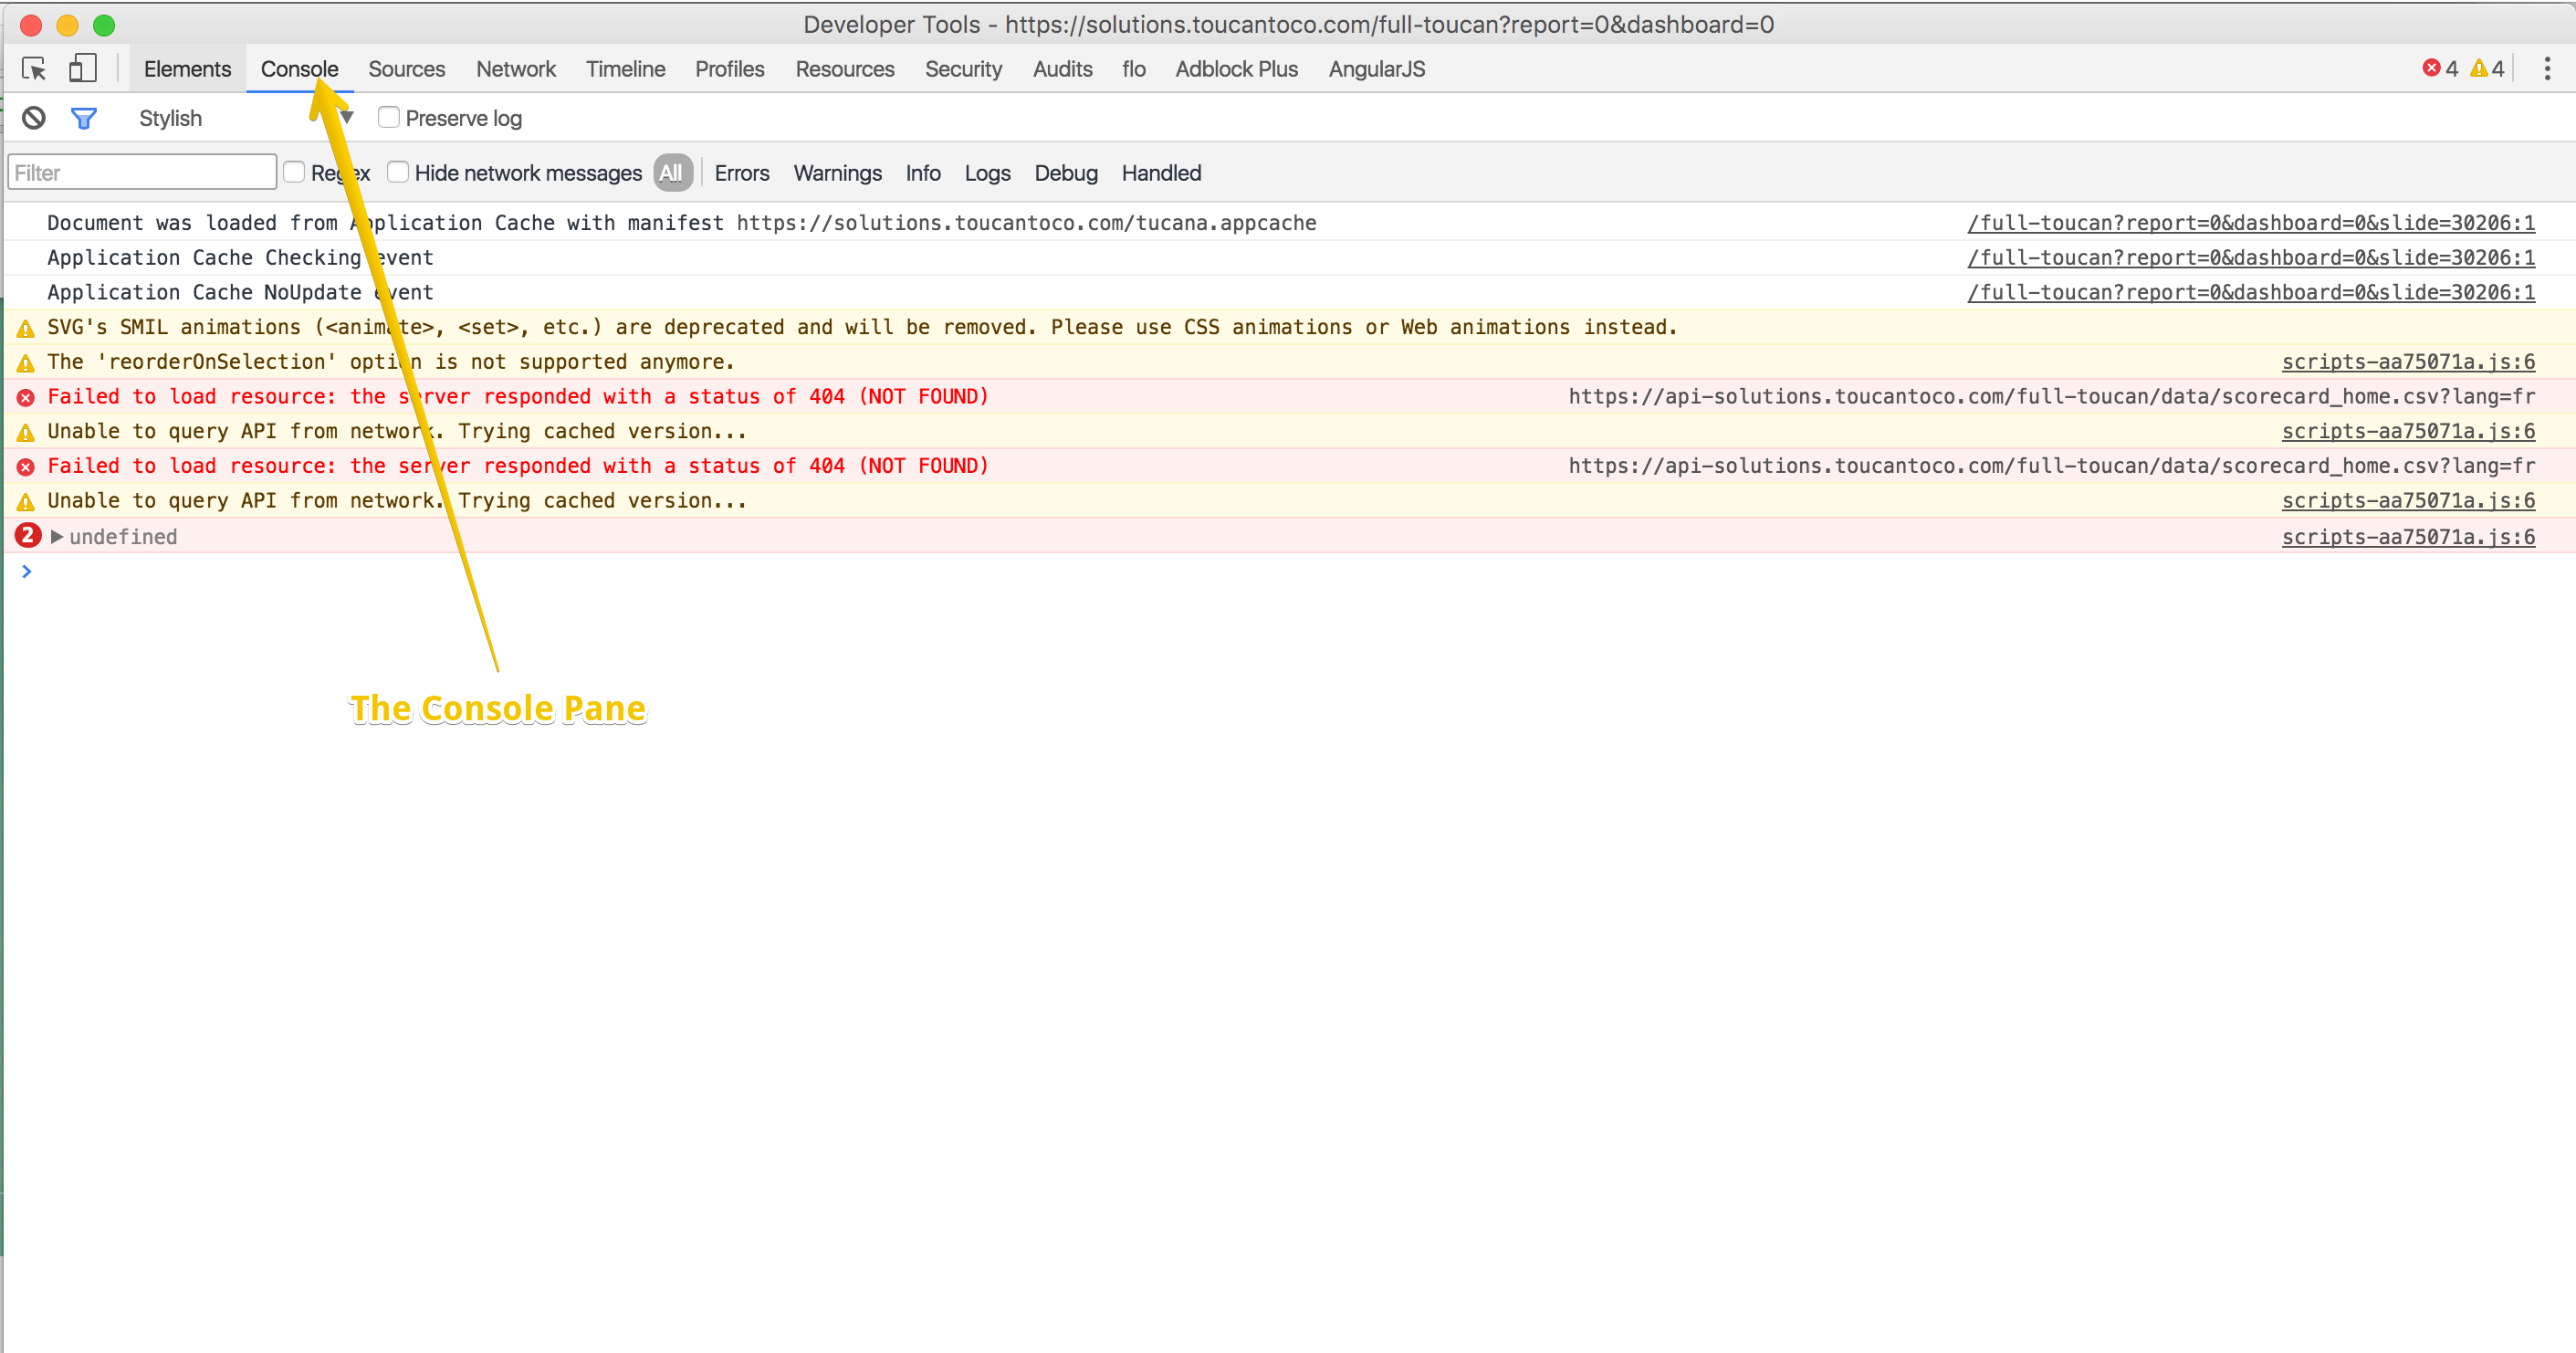
Devtools console
How to track a data problem ?
A data problem is easily debuggable. You’ll use the Chrome Developper Tools to Inspect the data returned by the back end.
Here are classic data config problems:
- the domain I use in my query is the one I specified in the etl_config or one that I can check in the “available domains” ?
- If you use the Aggregation Framework did you treat data query as an
array like
query: []and not like a normal object ? Did you add,to delimit your steps ? - If you’re using the multiple queries did you add the
multiple_queries:trueoption ?
Inspect the data
In the Network Pane of the Chrome Dev Tools look for data requests.
You’ll be able to see each request and inspect all the rows returned. That way you’ll see if what you get is what you expect.
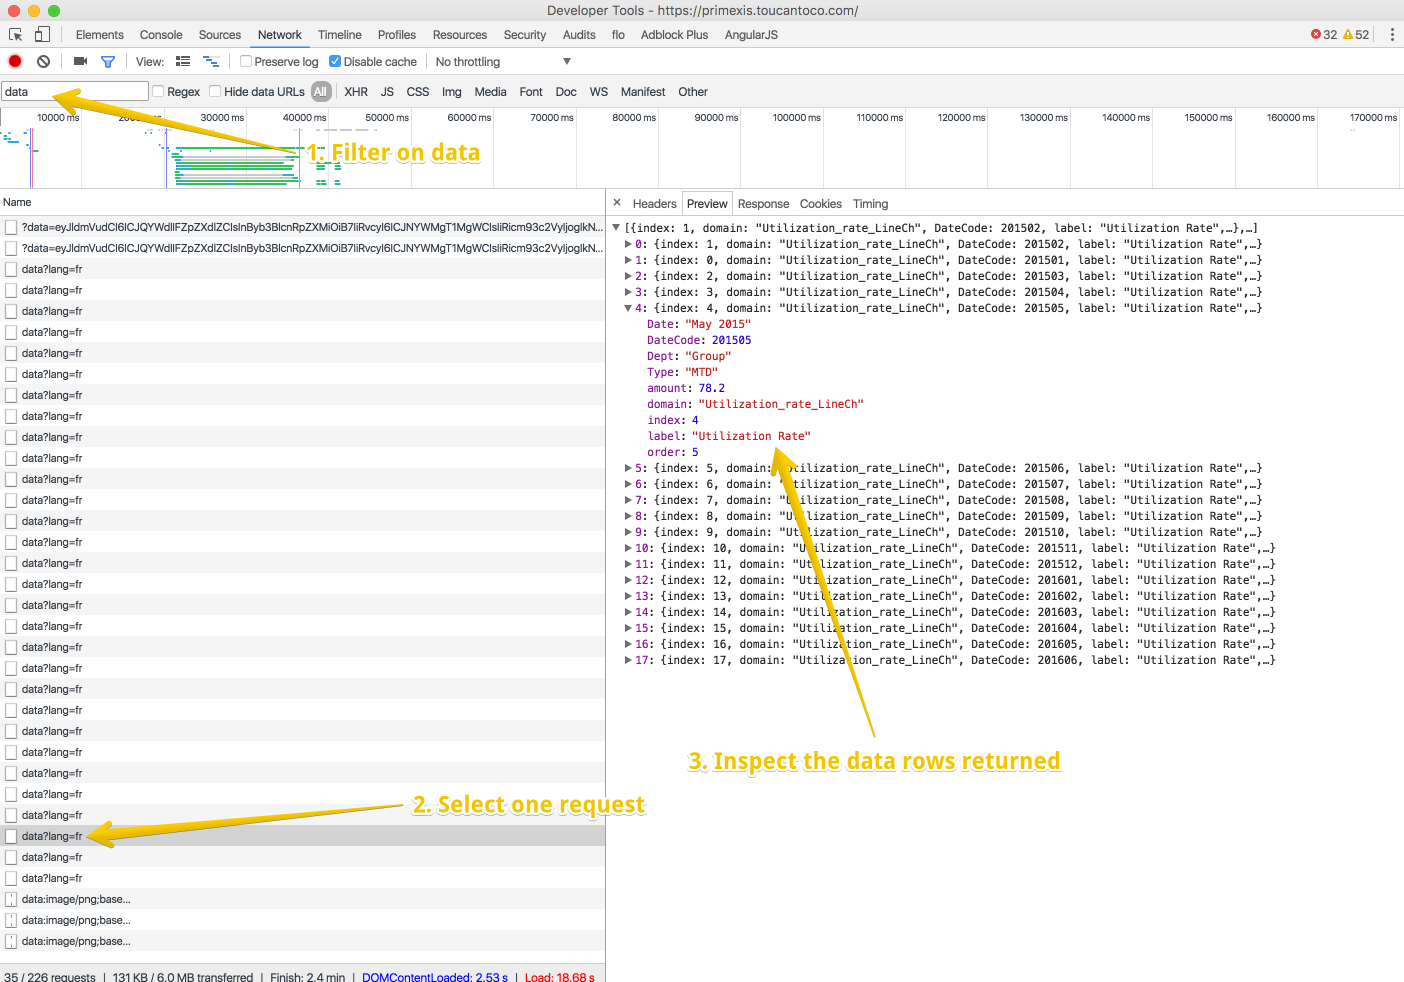
Devtools data II
To select the actual query you want to inspect among all the requests
made, select the Headers subpane and inspect the Request Payload. It
will display the data query supplied to the database and help you find
the one you’re interested into.
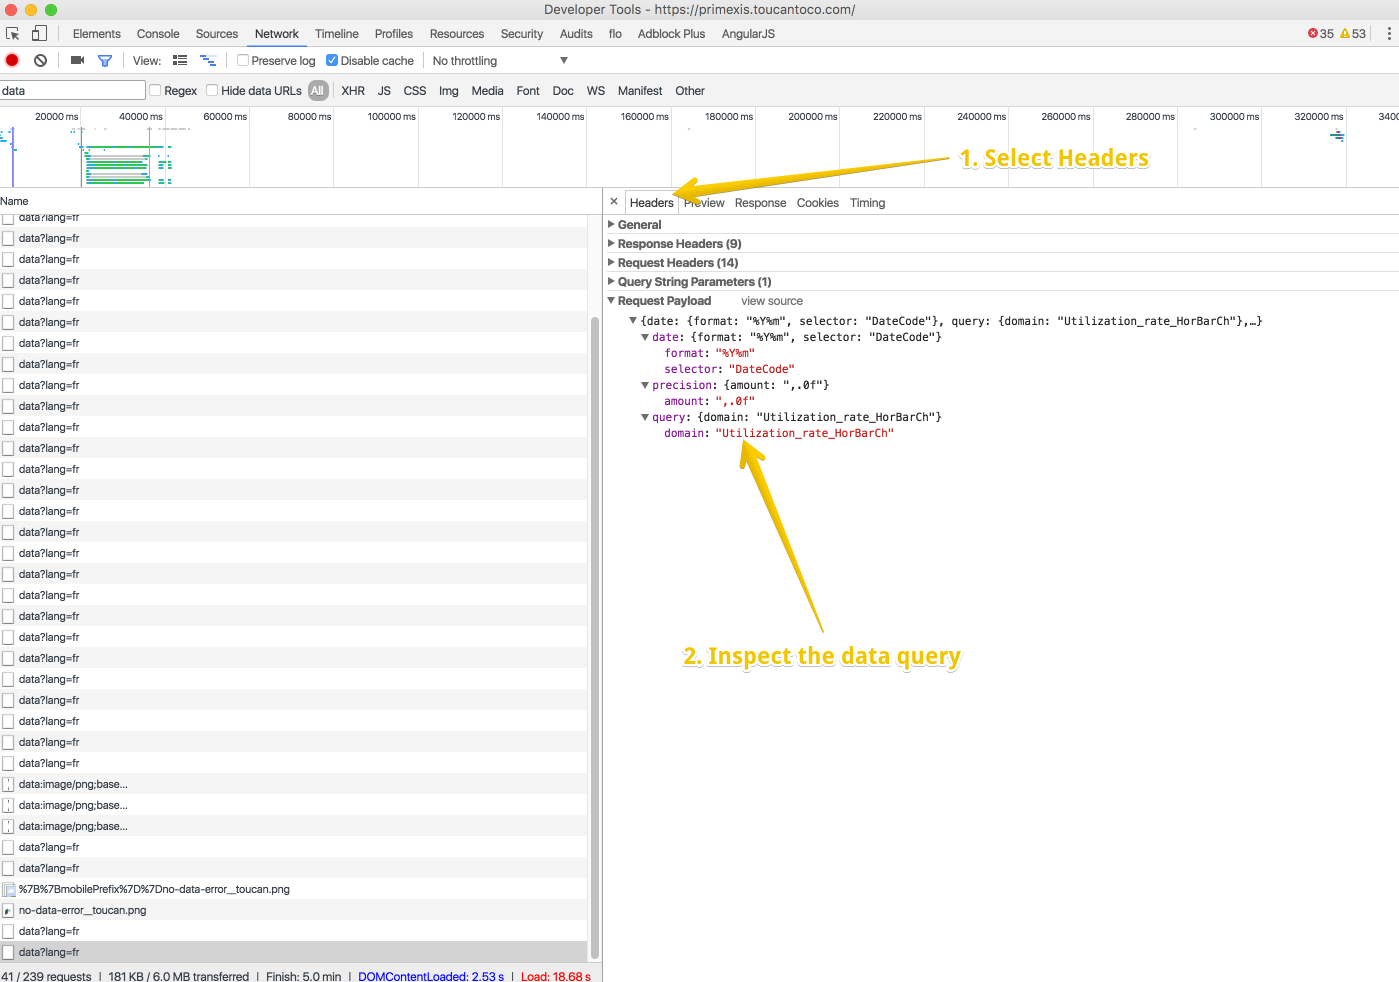
Devtools data I
If your request is colored in red with a 500 error code that could either mean:
- your aggregation framework query is not correct
- your postprocess block is not correct
Dashboards Specifics Problems
Most of the problems come from the etl_config if you did not specify
the correct join column with the report in the report entry.
You can also have templates errors:
- If your reports has one dashboard, do they all have the
default:trueoption ? - If your reports has multiple dashboards, did you use the
default: {{ DEFAULT_COLUMN | bool}}option to determine the only one that should be the default dashboard ?
Slides Specifics Problems
I don’t see my slide:
- Does this slide has an existing
parent_idand an uniqueid?
No Data Available
You have a data problem. The backend does not return any data. Refer to “How to track a data problem”
If you’re using a Google Spreadsheet data provider:
- Shipping variables
- Is the optional
google_spreadsheetconnector enabled?
- Regarding the spreadsheet:
- Is the spreadsheet shared with: toucanserviceaccount@testproj-204816.iam.gserviceaccount.com?
- Does the sheet have the correct languages / internationalization settings ? If your browser is in French select “région suisse” and numbers columns to “123 > nombre”
- Is the decimal separator a point
.and not a comma,? - Are your dates in the correct format like “25/12/2015” ?
- In the etl_config
- Do you have a well-configured GoogleSpreadsheet provider in your DATA_PROVIDERS block?
- Does you data source share the same
nameas this provider? - Is the data source spreadsheet_id correct?
Data Request Limit
In order to prevent performance issues, we’ve added a safeguard limit on the number of cells (lines x columns) that can be requested. At Toucan, we do not recommend displaying too many data entries at once, because it can reduce the readability of your data story.
Reduce your request size
The preferred way to make this message disappear and solve this issue is simply to filter out columns or rows you don’t need from your data. This is what we would recommend. It might just be that you work with big datasets that you then reduce in size before displaying them in your story. If that’s the case, the error is temporary and shouldn’t prevent you from saving your work.
However if you encounter a “Data is too large” or “you have a lot of data” kind of error too often, don’t panic. Here’s how you can configure your application to allow bigger requests:
How to edit your etl configuration to increase the limit
- Go to FILES in the bottom toolbar.
- Click on the 📝 edit button for the “etl_config” file
- Look for the
DF_MAX_CELLSparameter field. If it doesn’t exist, you can just add it.
By default, we set the limit to 200000 cells (lines x columns). In the error message you should have an indication of the size of your request and how much you might want to raise the limit. For instance if the message says: “The request returned 420000 cells, which exceeds the safeguard limit of 200000”.
You can write down:
DF_MAX_CELLS: 450000
Save and you’re set!