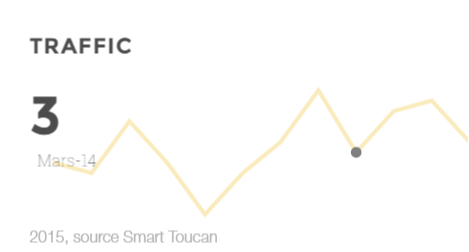
Tile Line
Options
| Parameter | Type | Value returned | Description |
|---|---|---|---|
value |
mandatory | string |
column name containing the value to be represented by the line |
date |
mandatory | string |
column name containing your date field |
data/date/format |
mandatory | string |
describe how your data source date format is structured, e.g ‘%Y-%m’ for ‘2015-12’. See this link for more details. |
data/date/selector |
mandatory | string |
column name containing your date field |
datesOrder |
optional | string |
Custom ordering rule for dates. Specify an array of labels or a column name containing the order.(for example a ‘month’ column containing onth names such as ‘Jan’, ‘Feb’ etc.) based on the values of another column specified to the ‘datesOrder’ parameter (for example a ‘month_no’ column containing integers from 1 to 12) |
tickFormat |
optional | string |
describe how you wish to display dates in the axis ticks. For ex. if you want to display a week number ‘S46’ instead of the default W46’, ` you can use this format: ‘S%W’ |
Code mode sample
id: "" #do not change this
name: ""
type: "line"
dataset: "my_dataset"
date: ""
value: ""