Toucan – Color Scheme Cheat Sheet
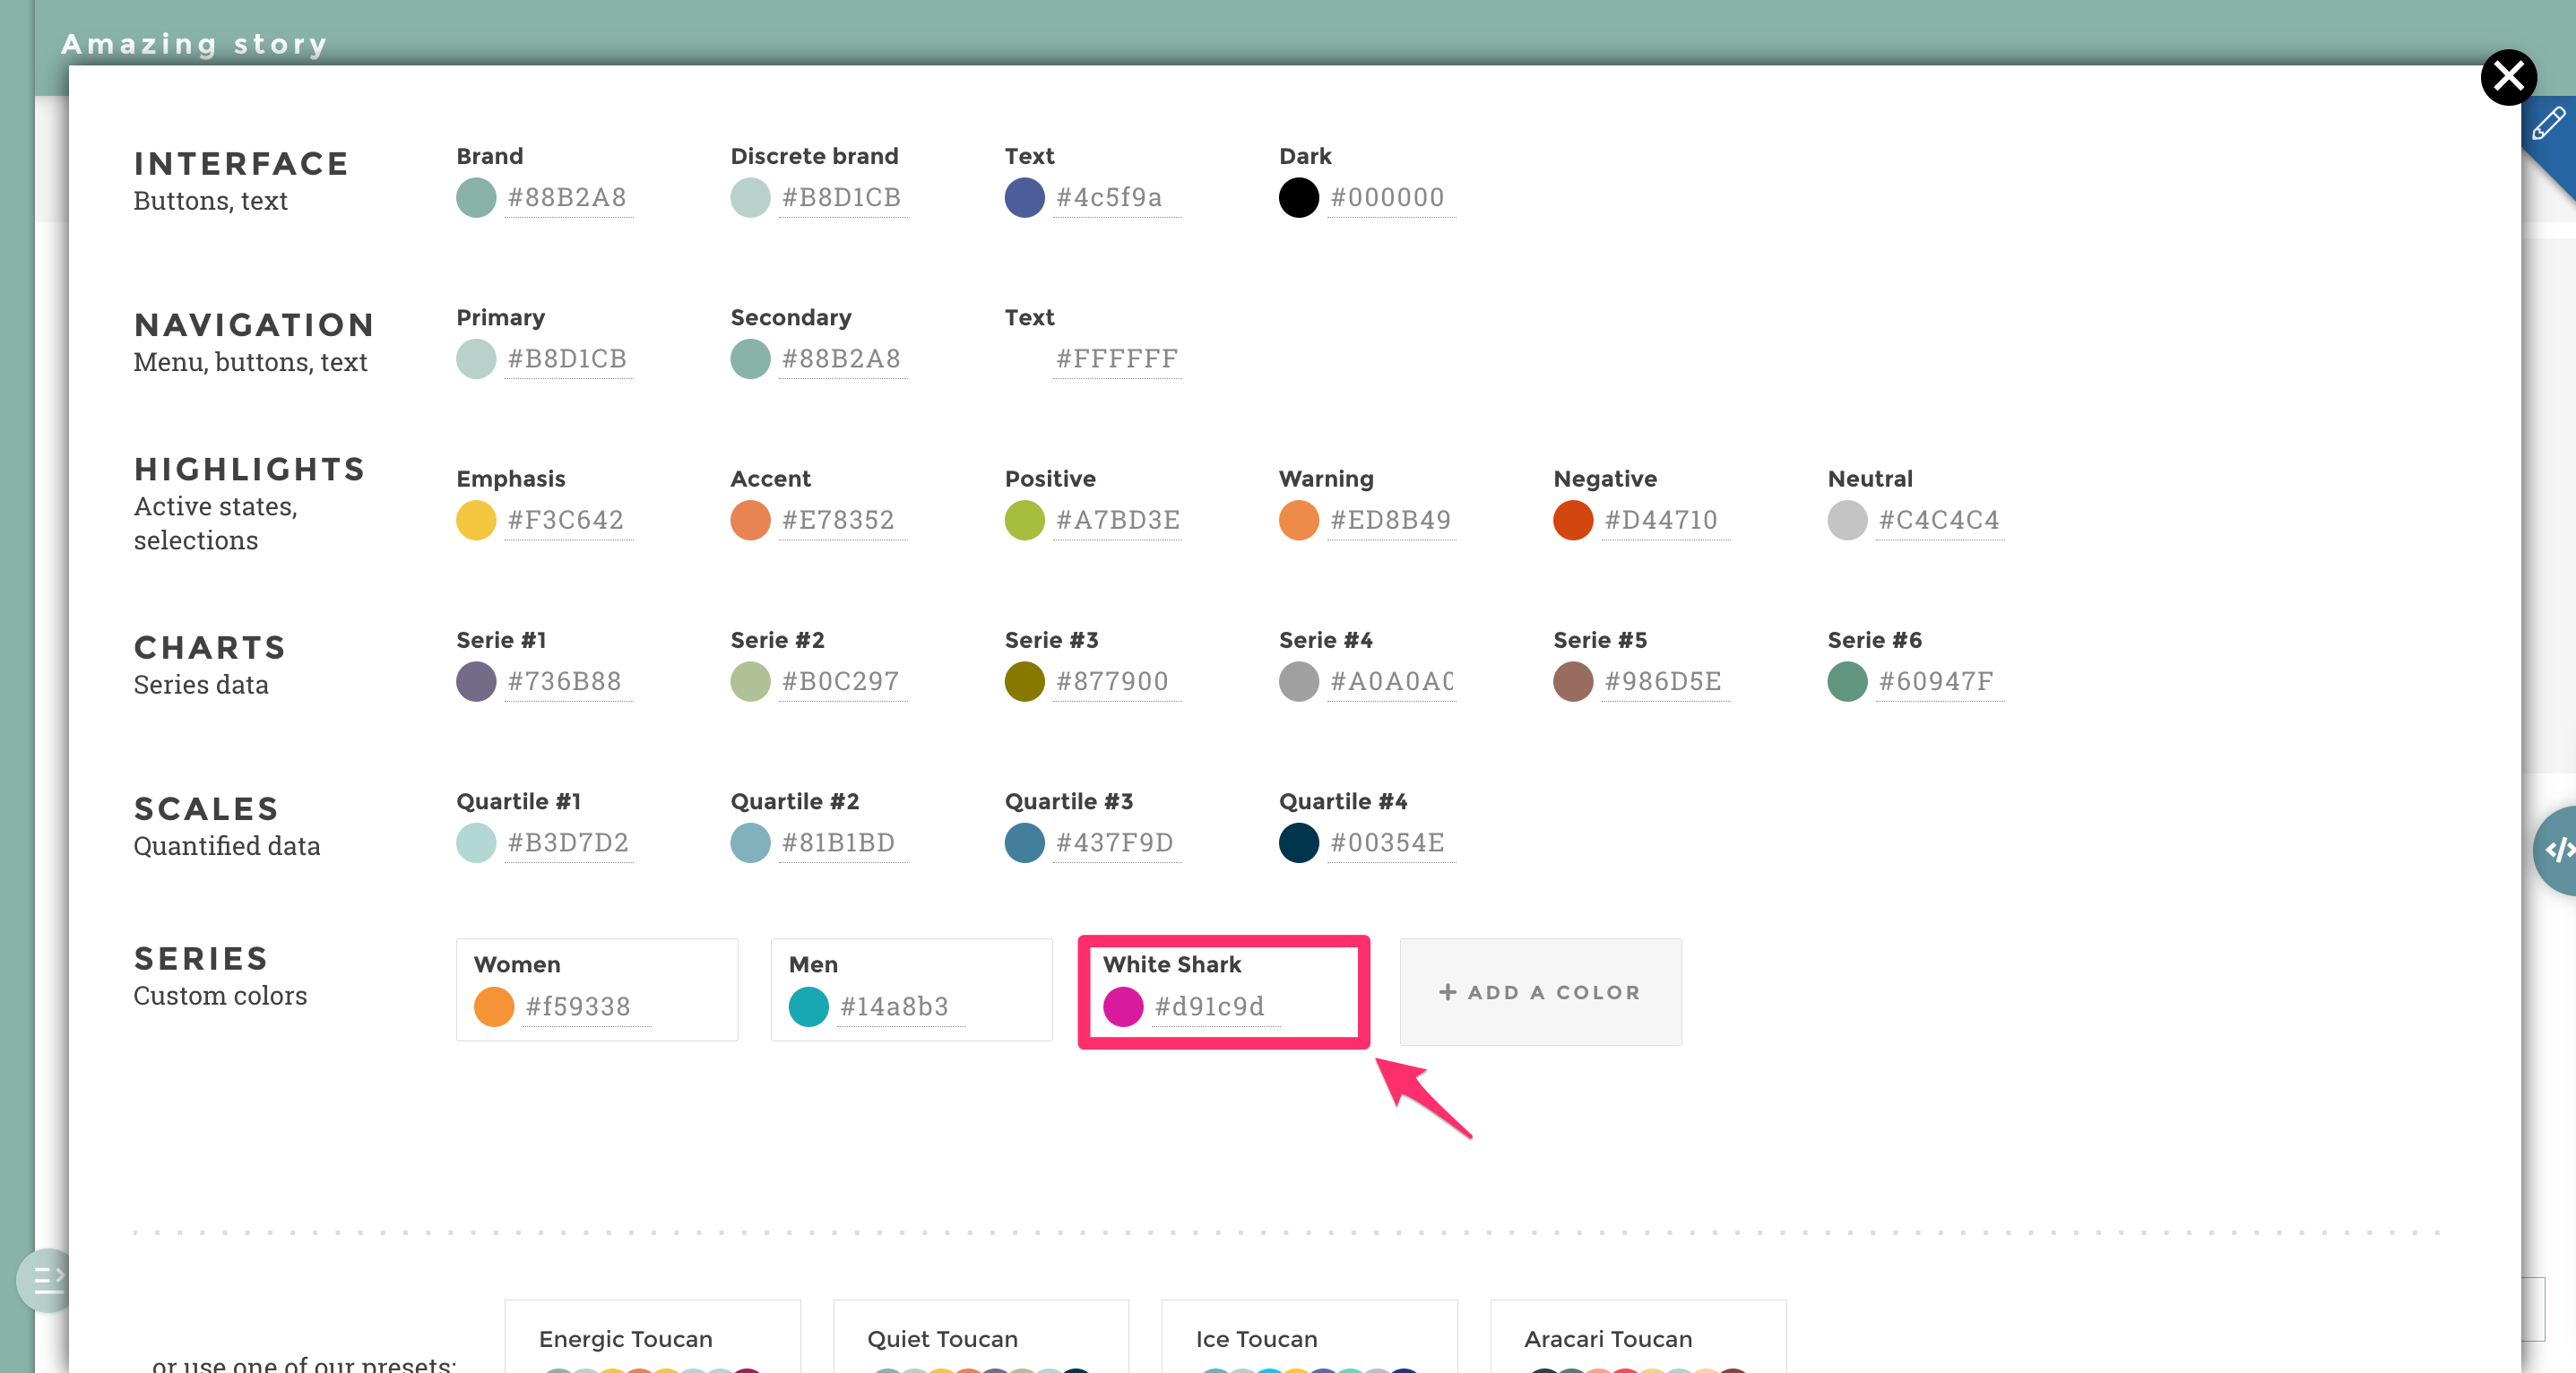
Color Series interface
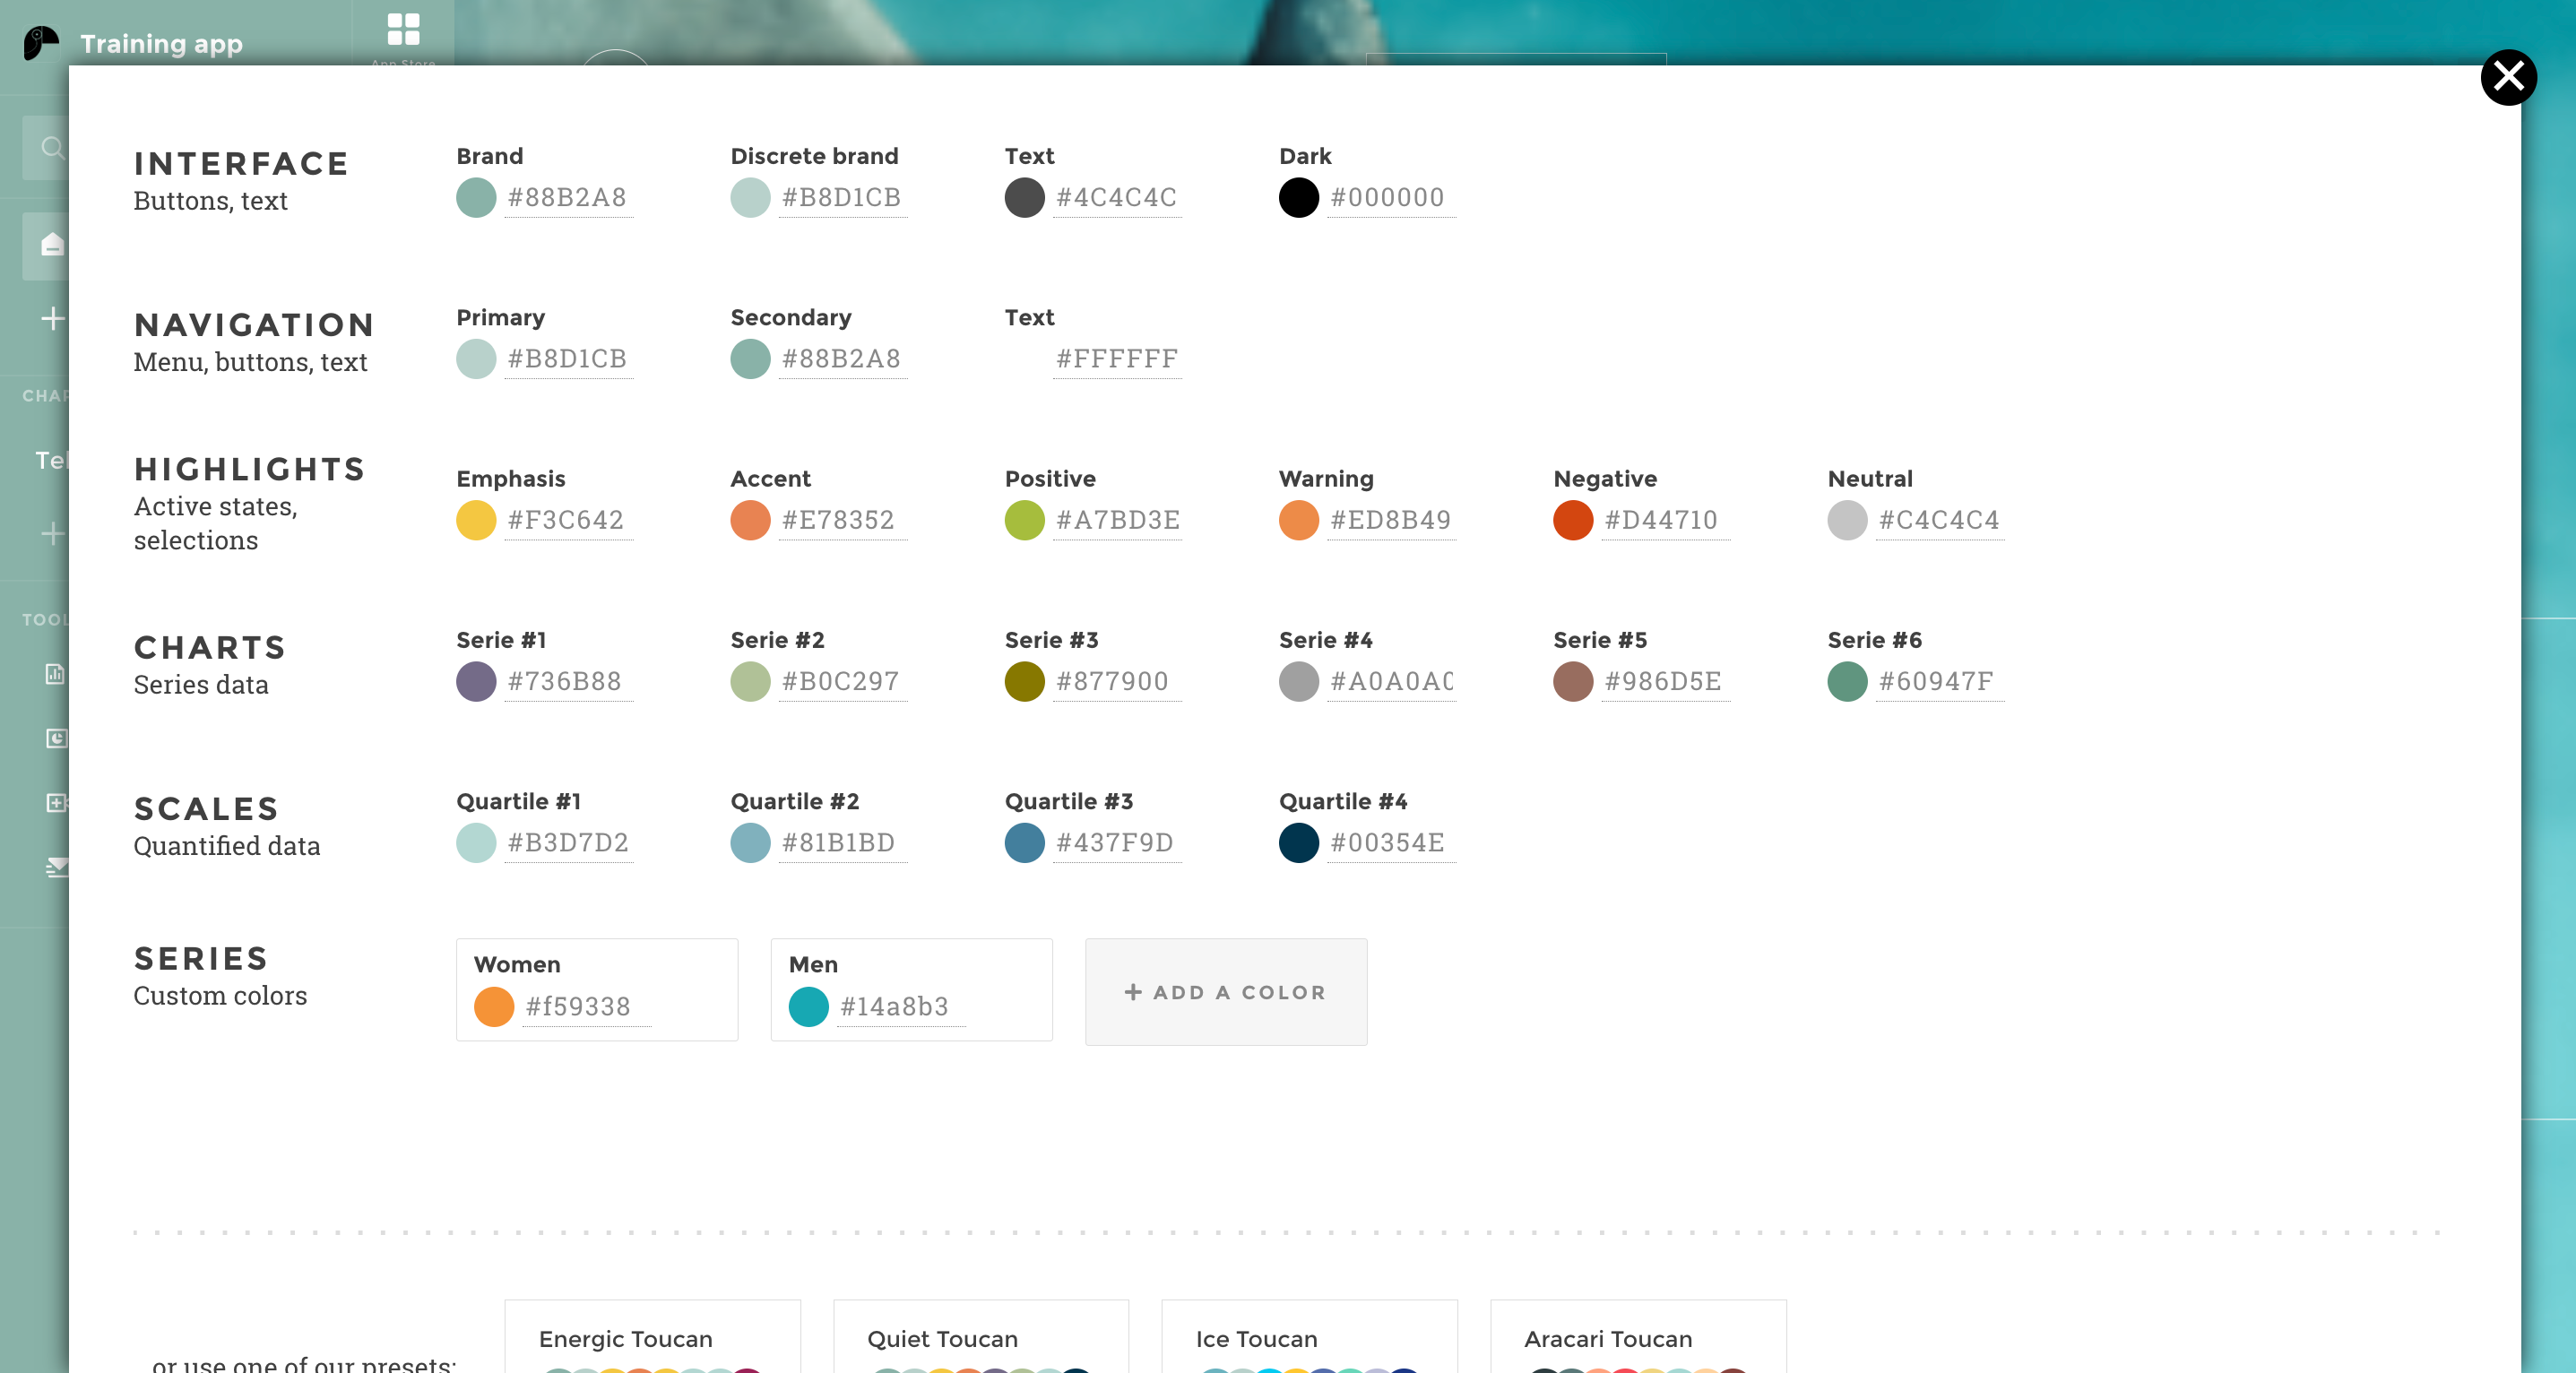
This is where you can manage the color of your small-app. Make this application your own by using your company’s visual identity! Each color is provided by its hex code.
CheatSheet_ColorScheme_1
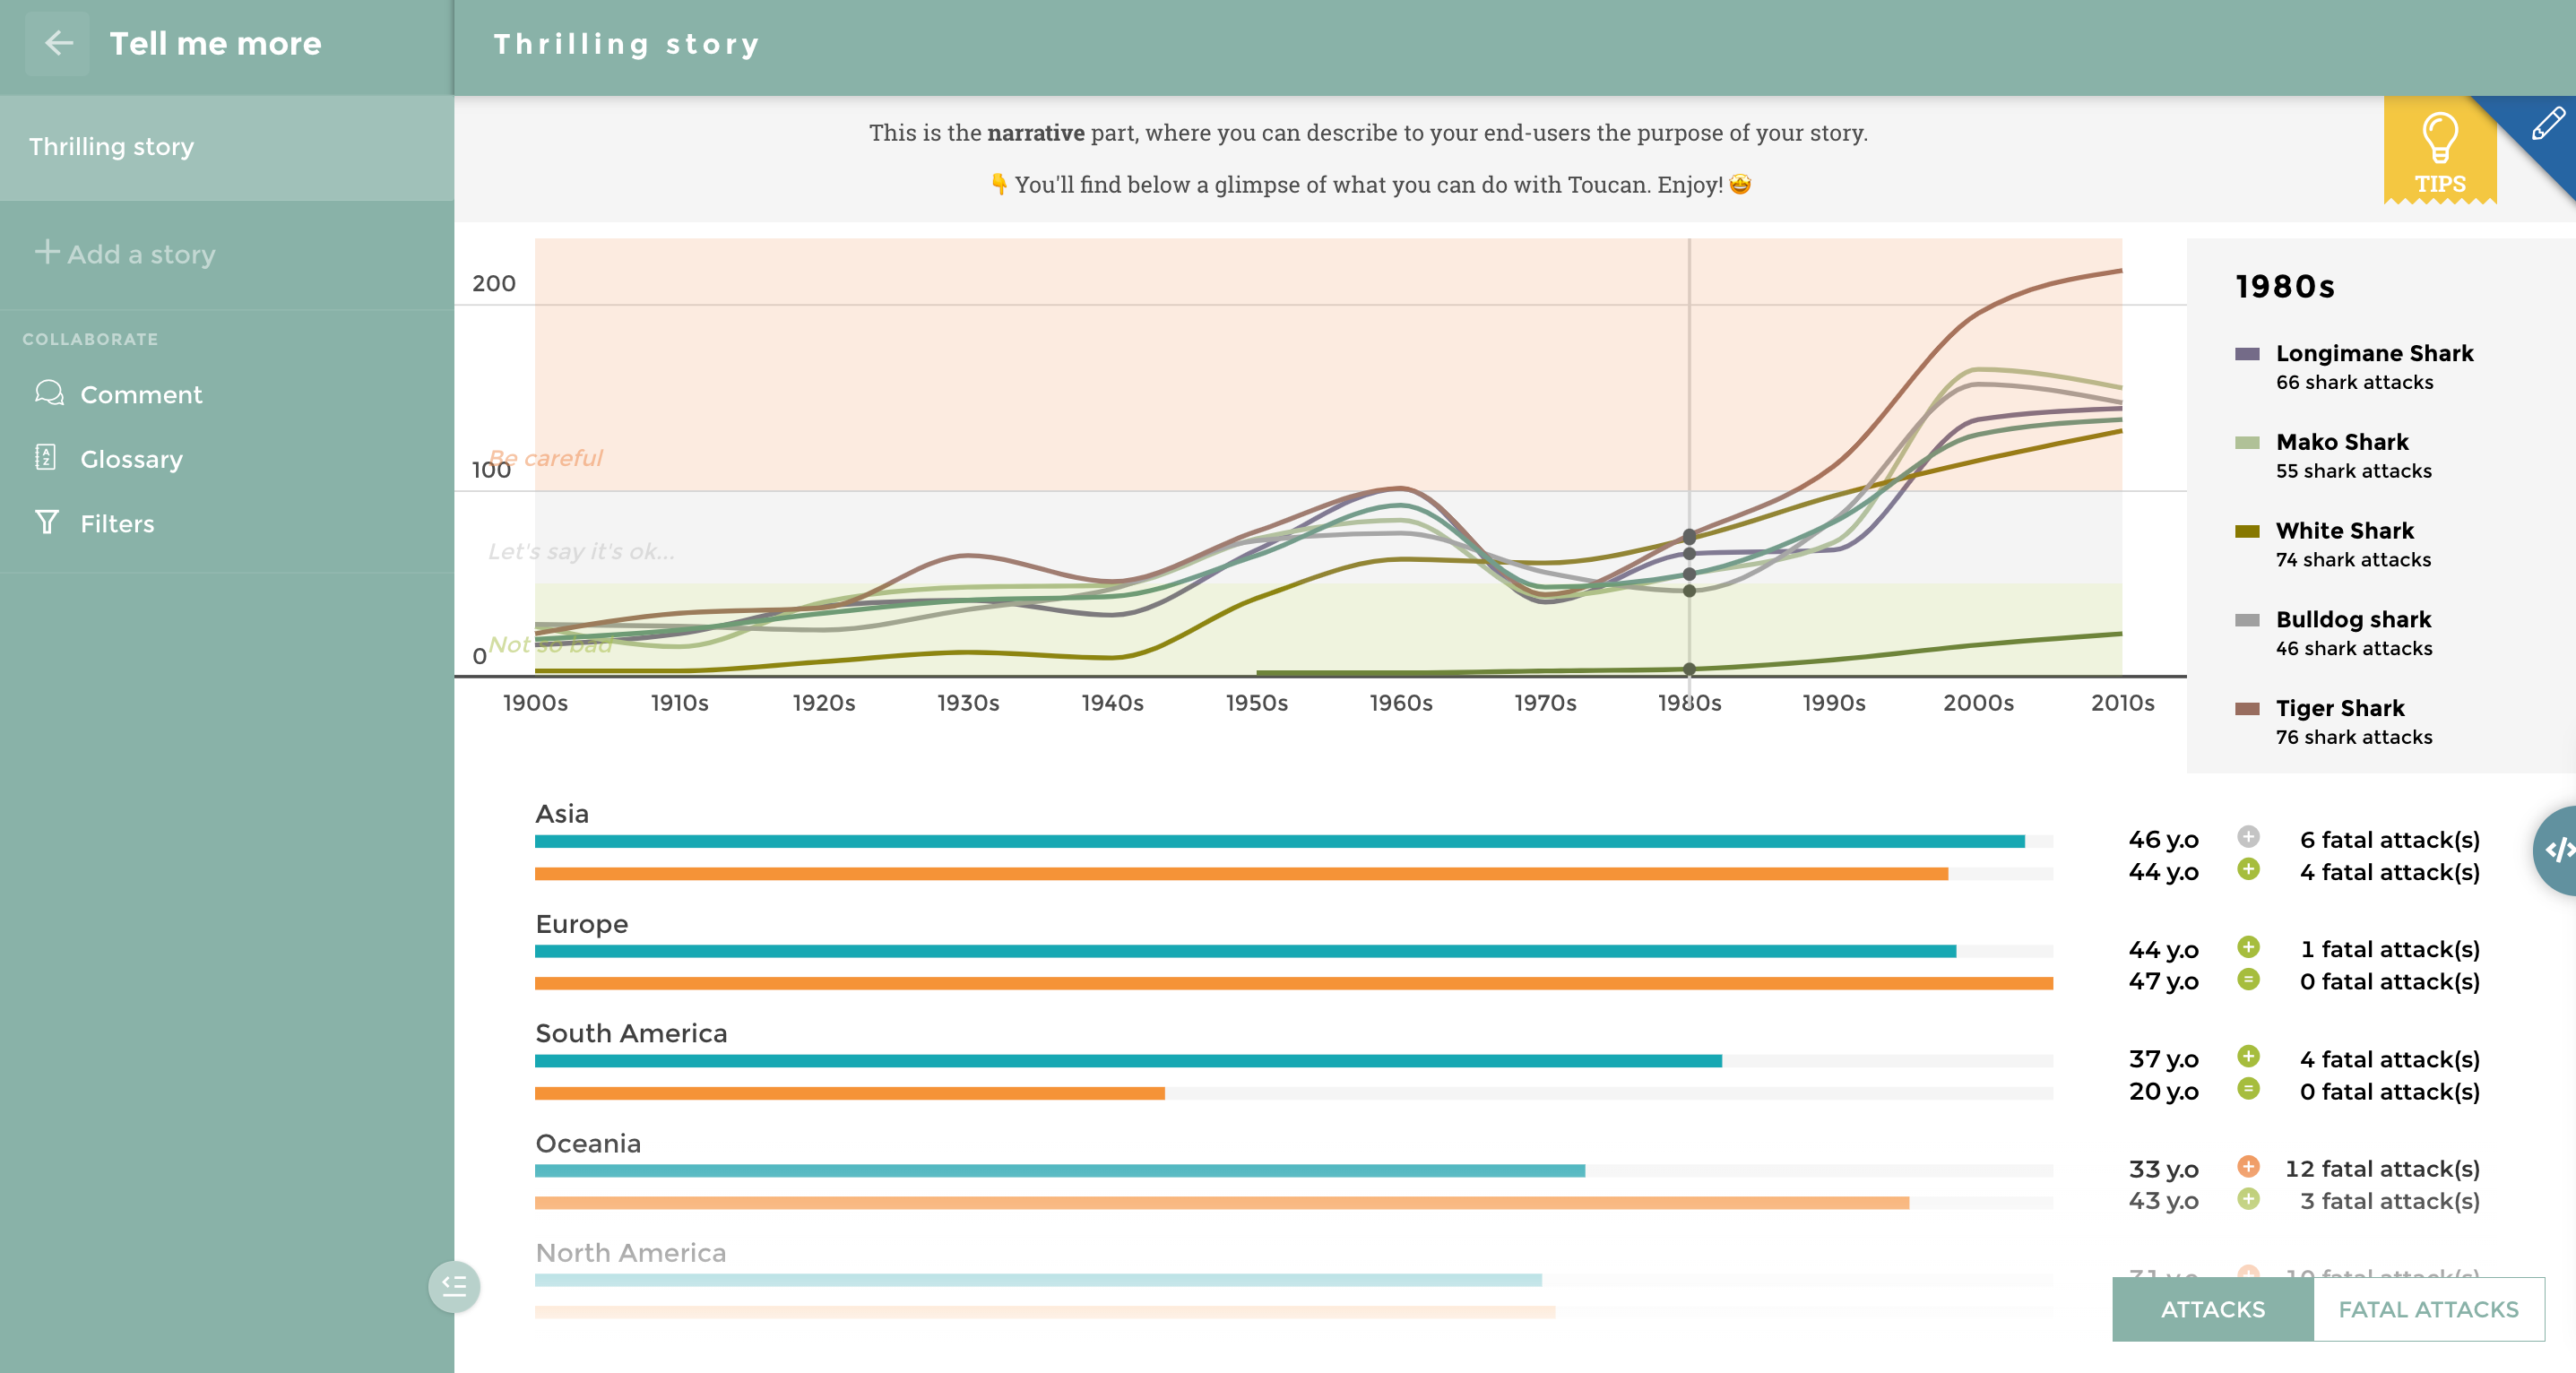
Let’s take this story as an example and let’s dig into each color to see how it impacts the app!
CheatSheet_ColorScheme_2
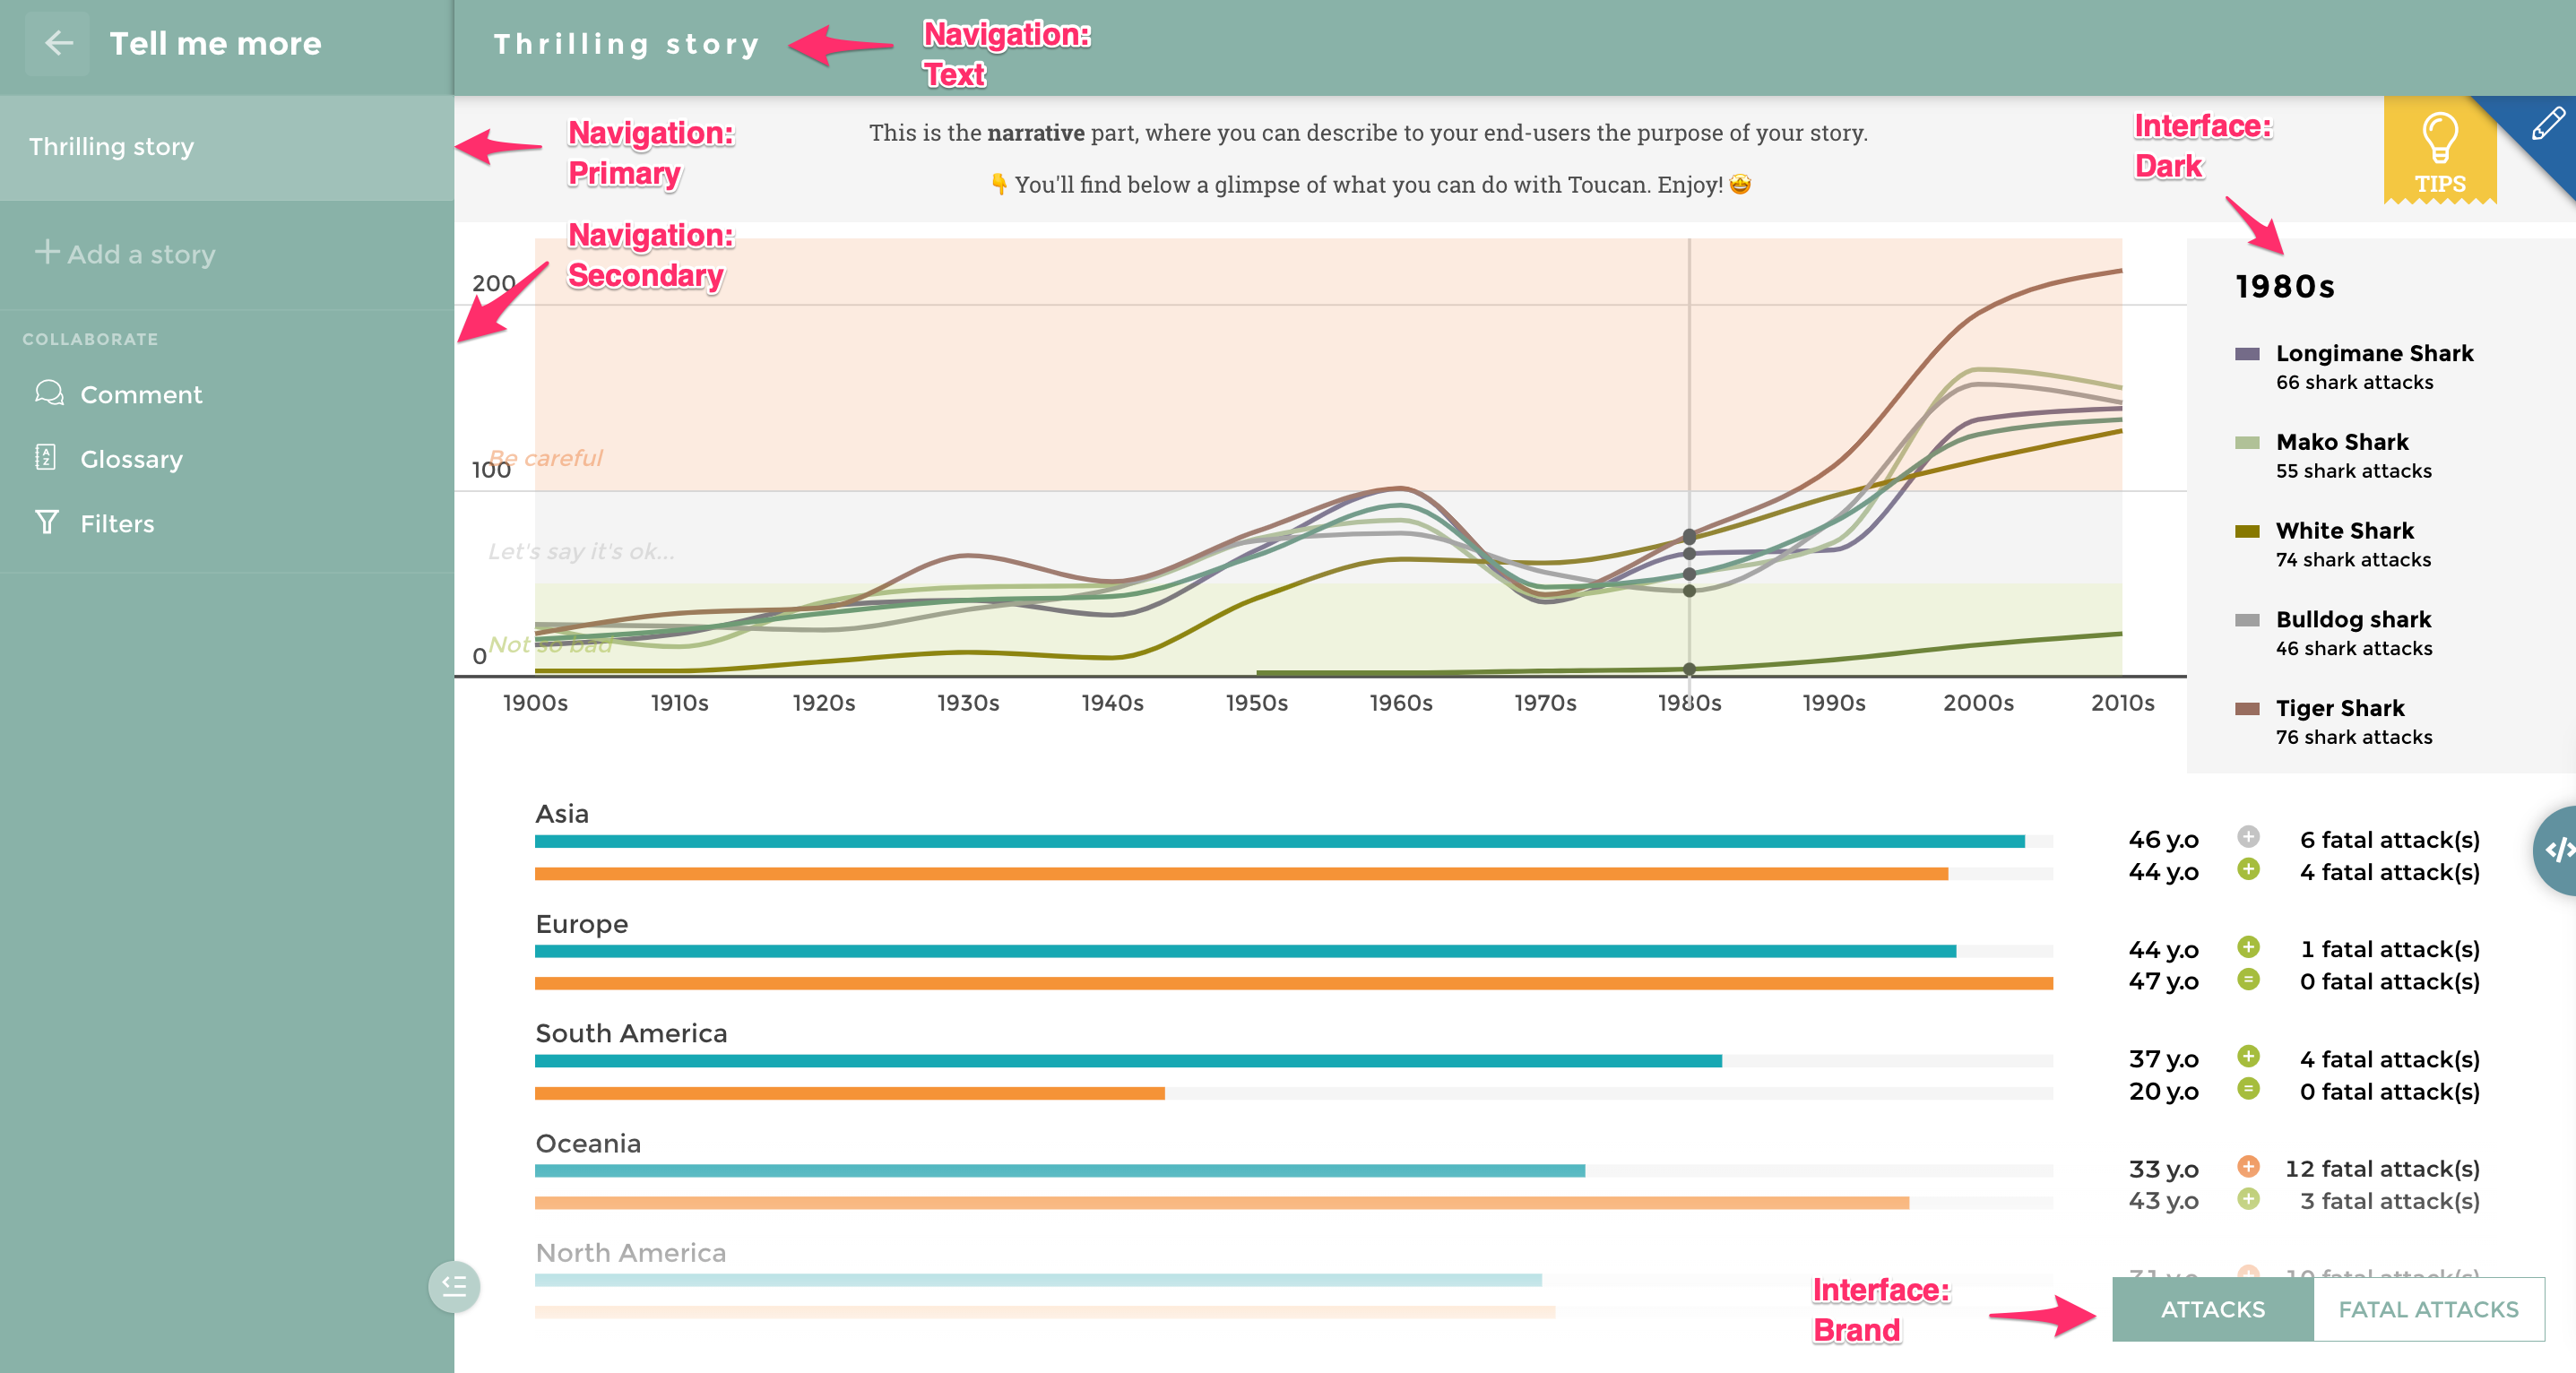
First, we have the Interface and the Navigation colors:
CheatSheet_ColorScheme_3
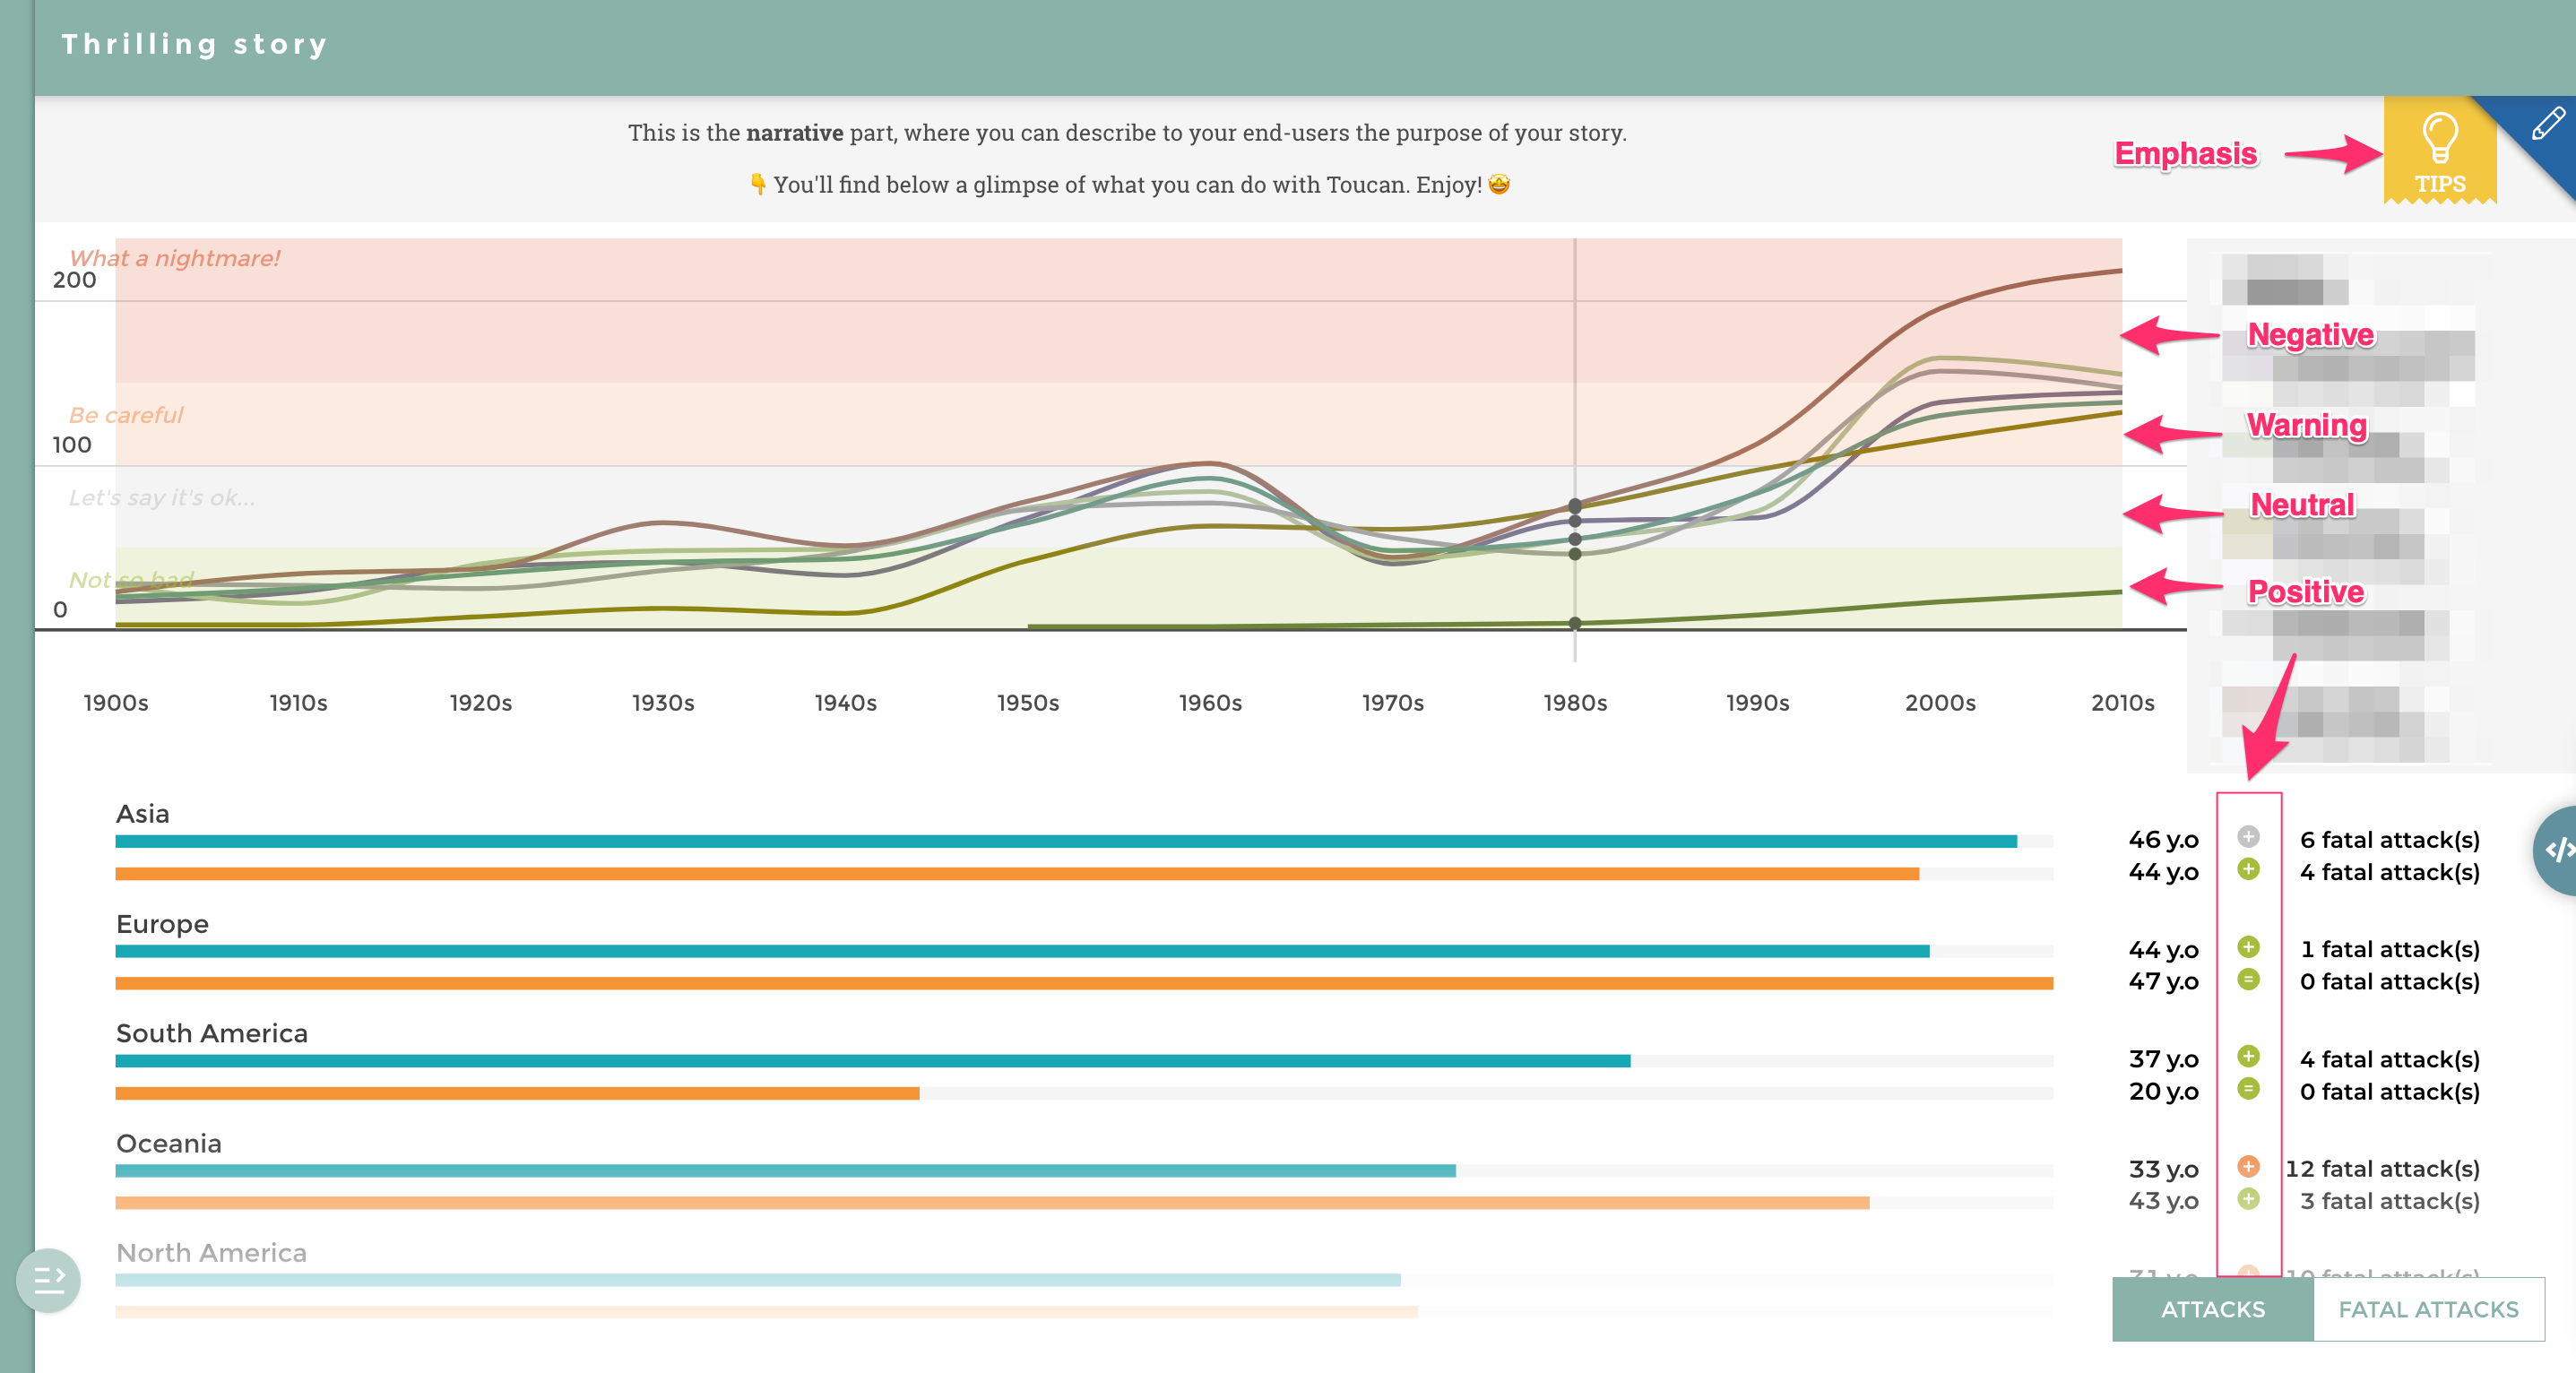
Then, we have the Highlights :
CheatSheet_ColorScheme_4
Note that each time a sentiment is set-up, the related colors (positive/neutral/warning/negative) are applied. This is why in the story example above, you can see them both on the color zones of the Linechart and on the variation on the leaderboard. Let’s see the Charts series now:
CheatSheet_ColorScheme_5
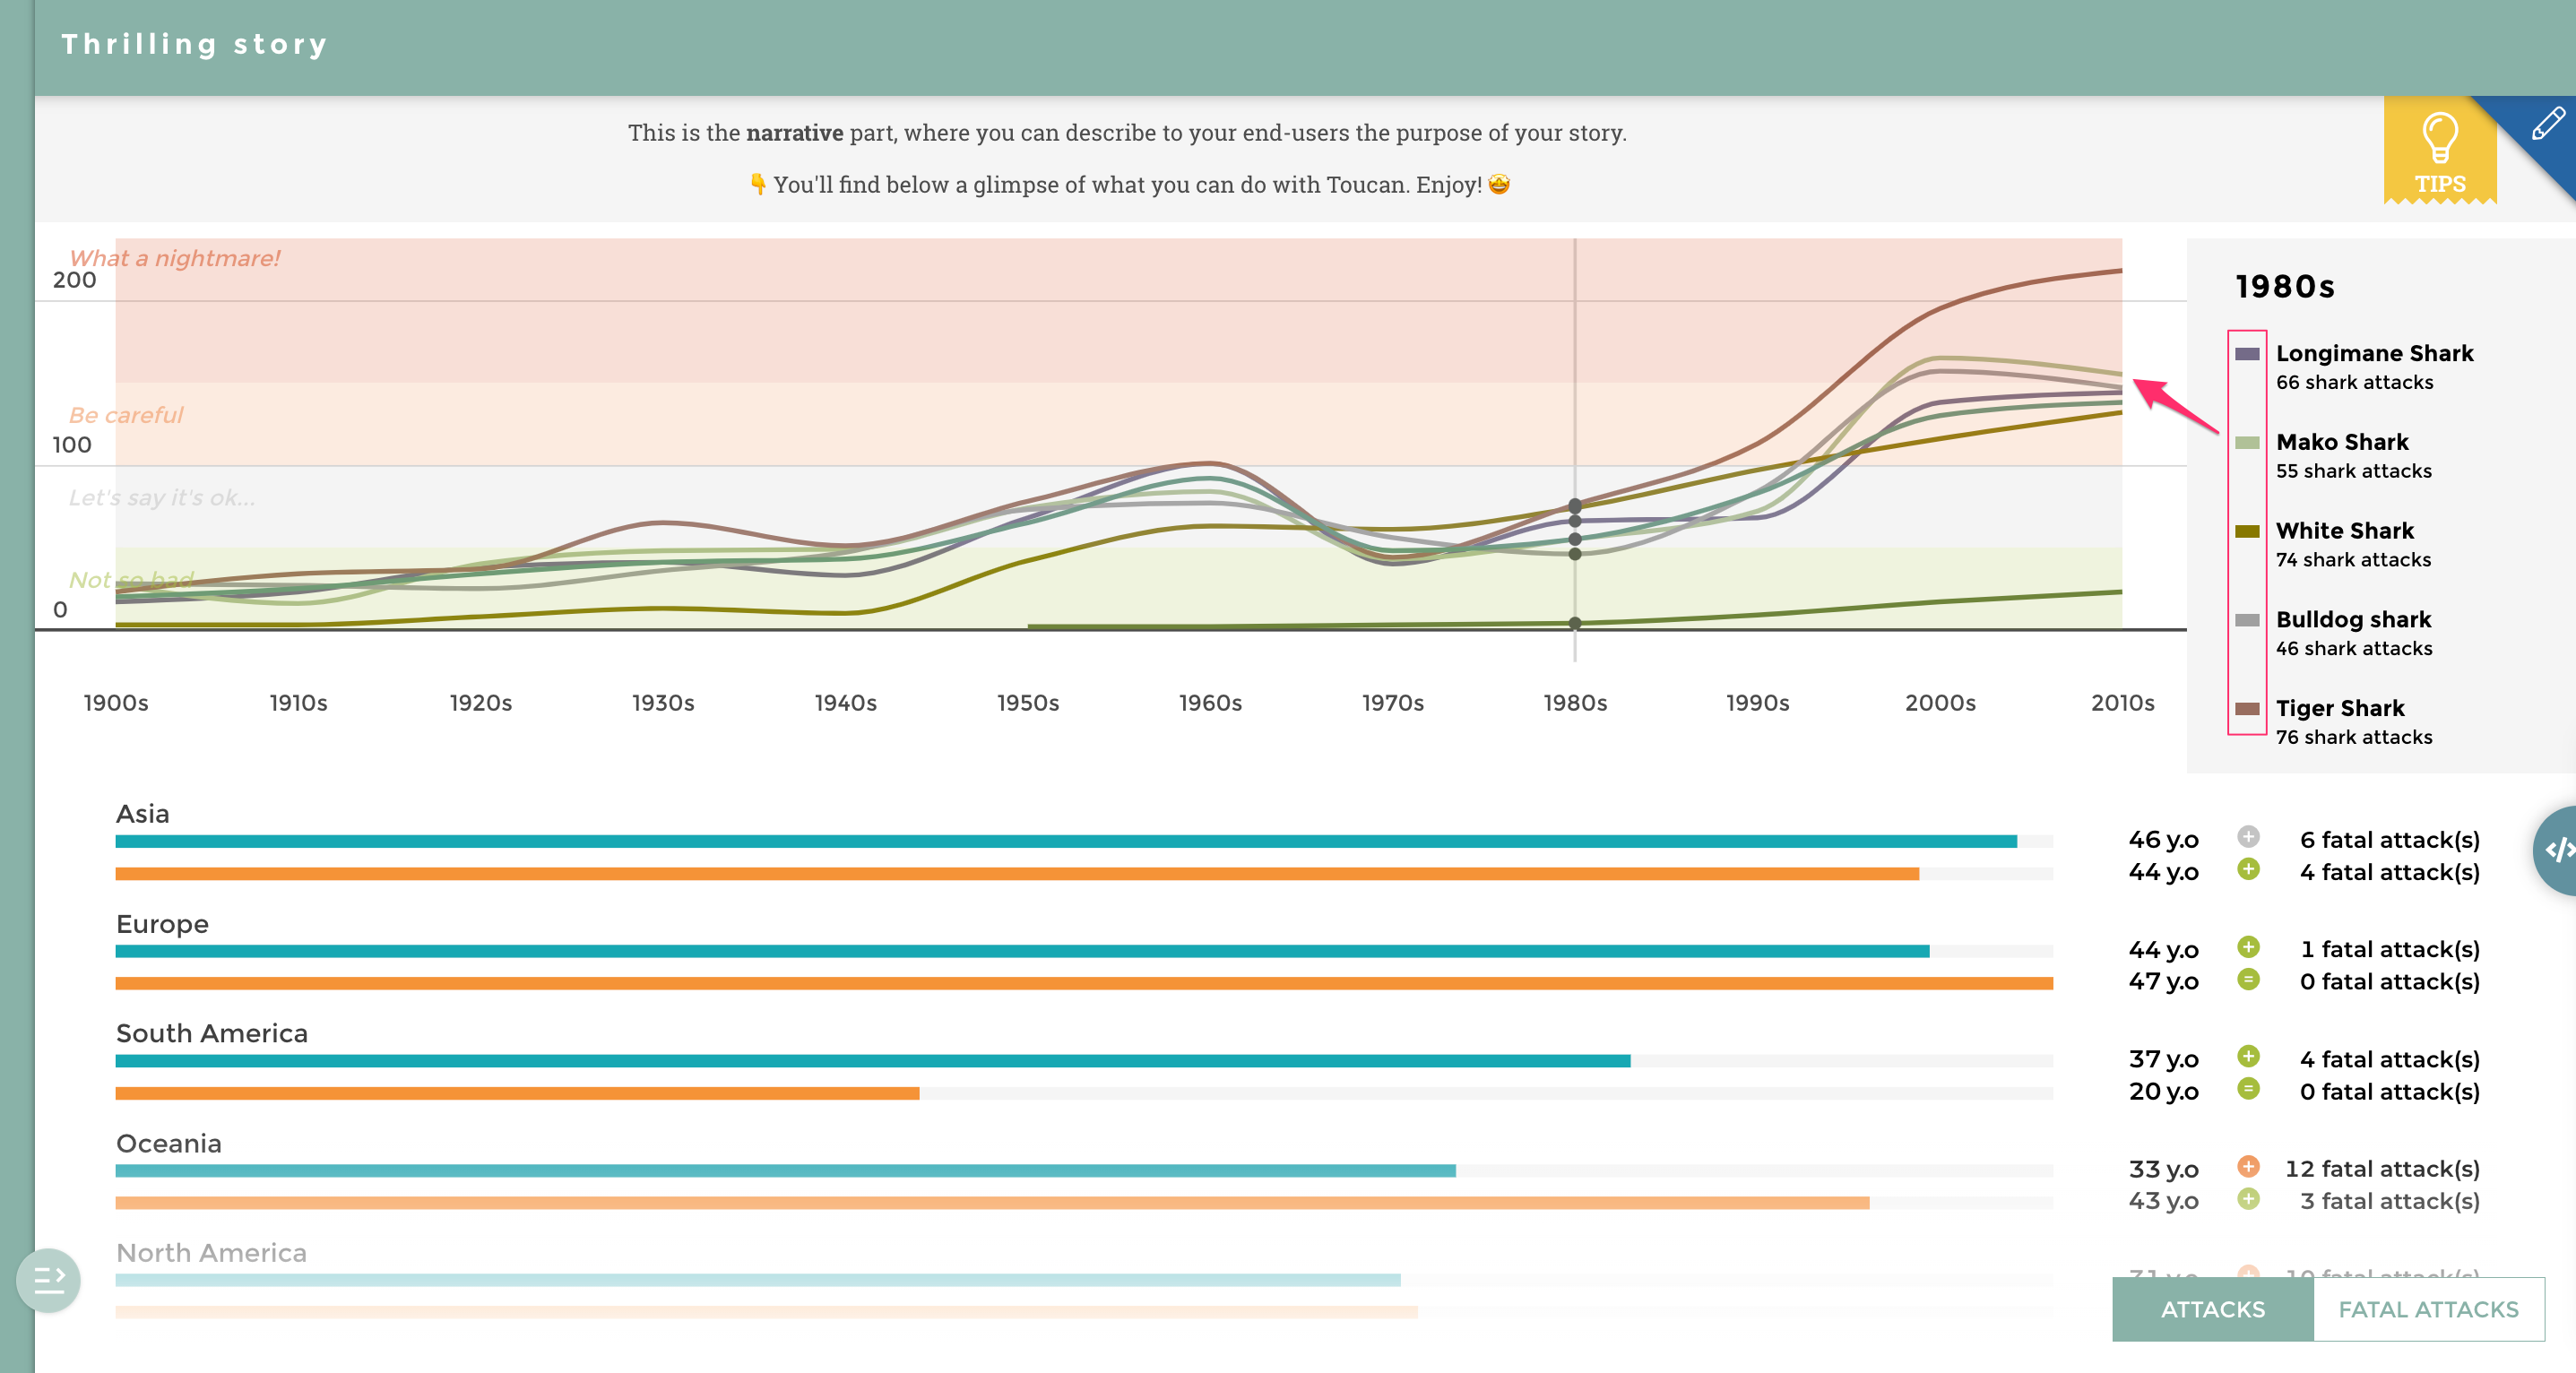
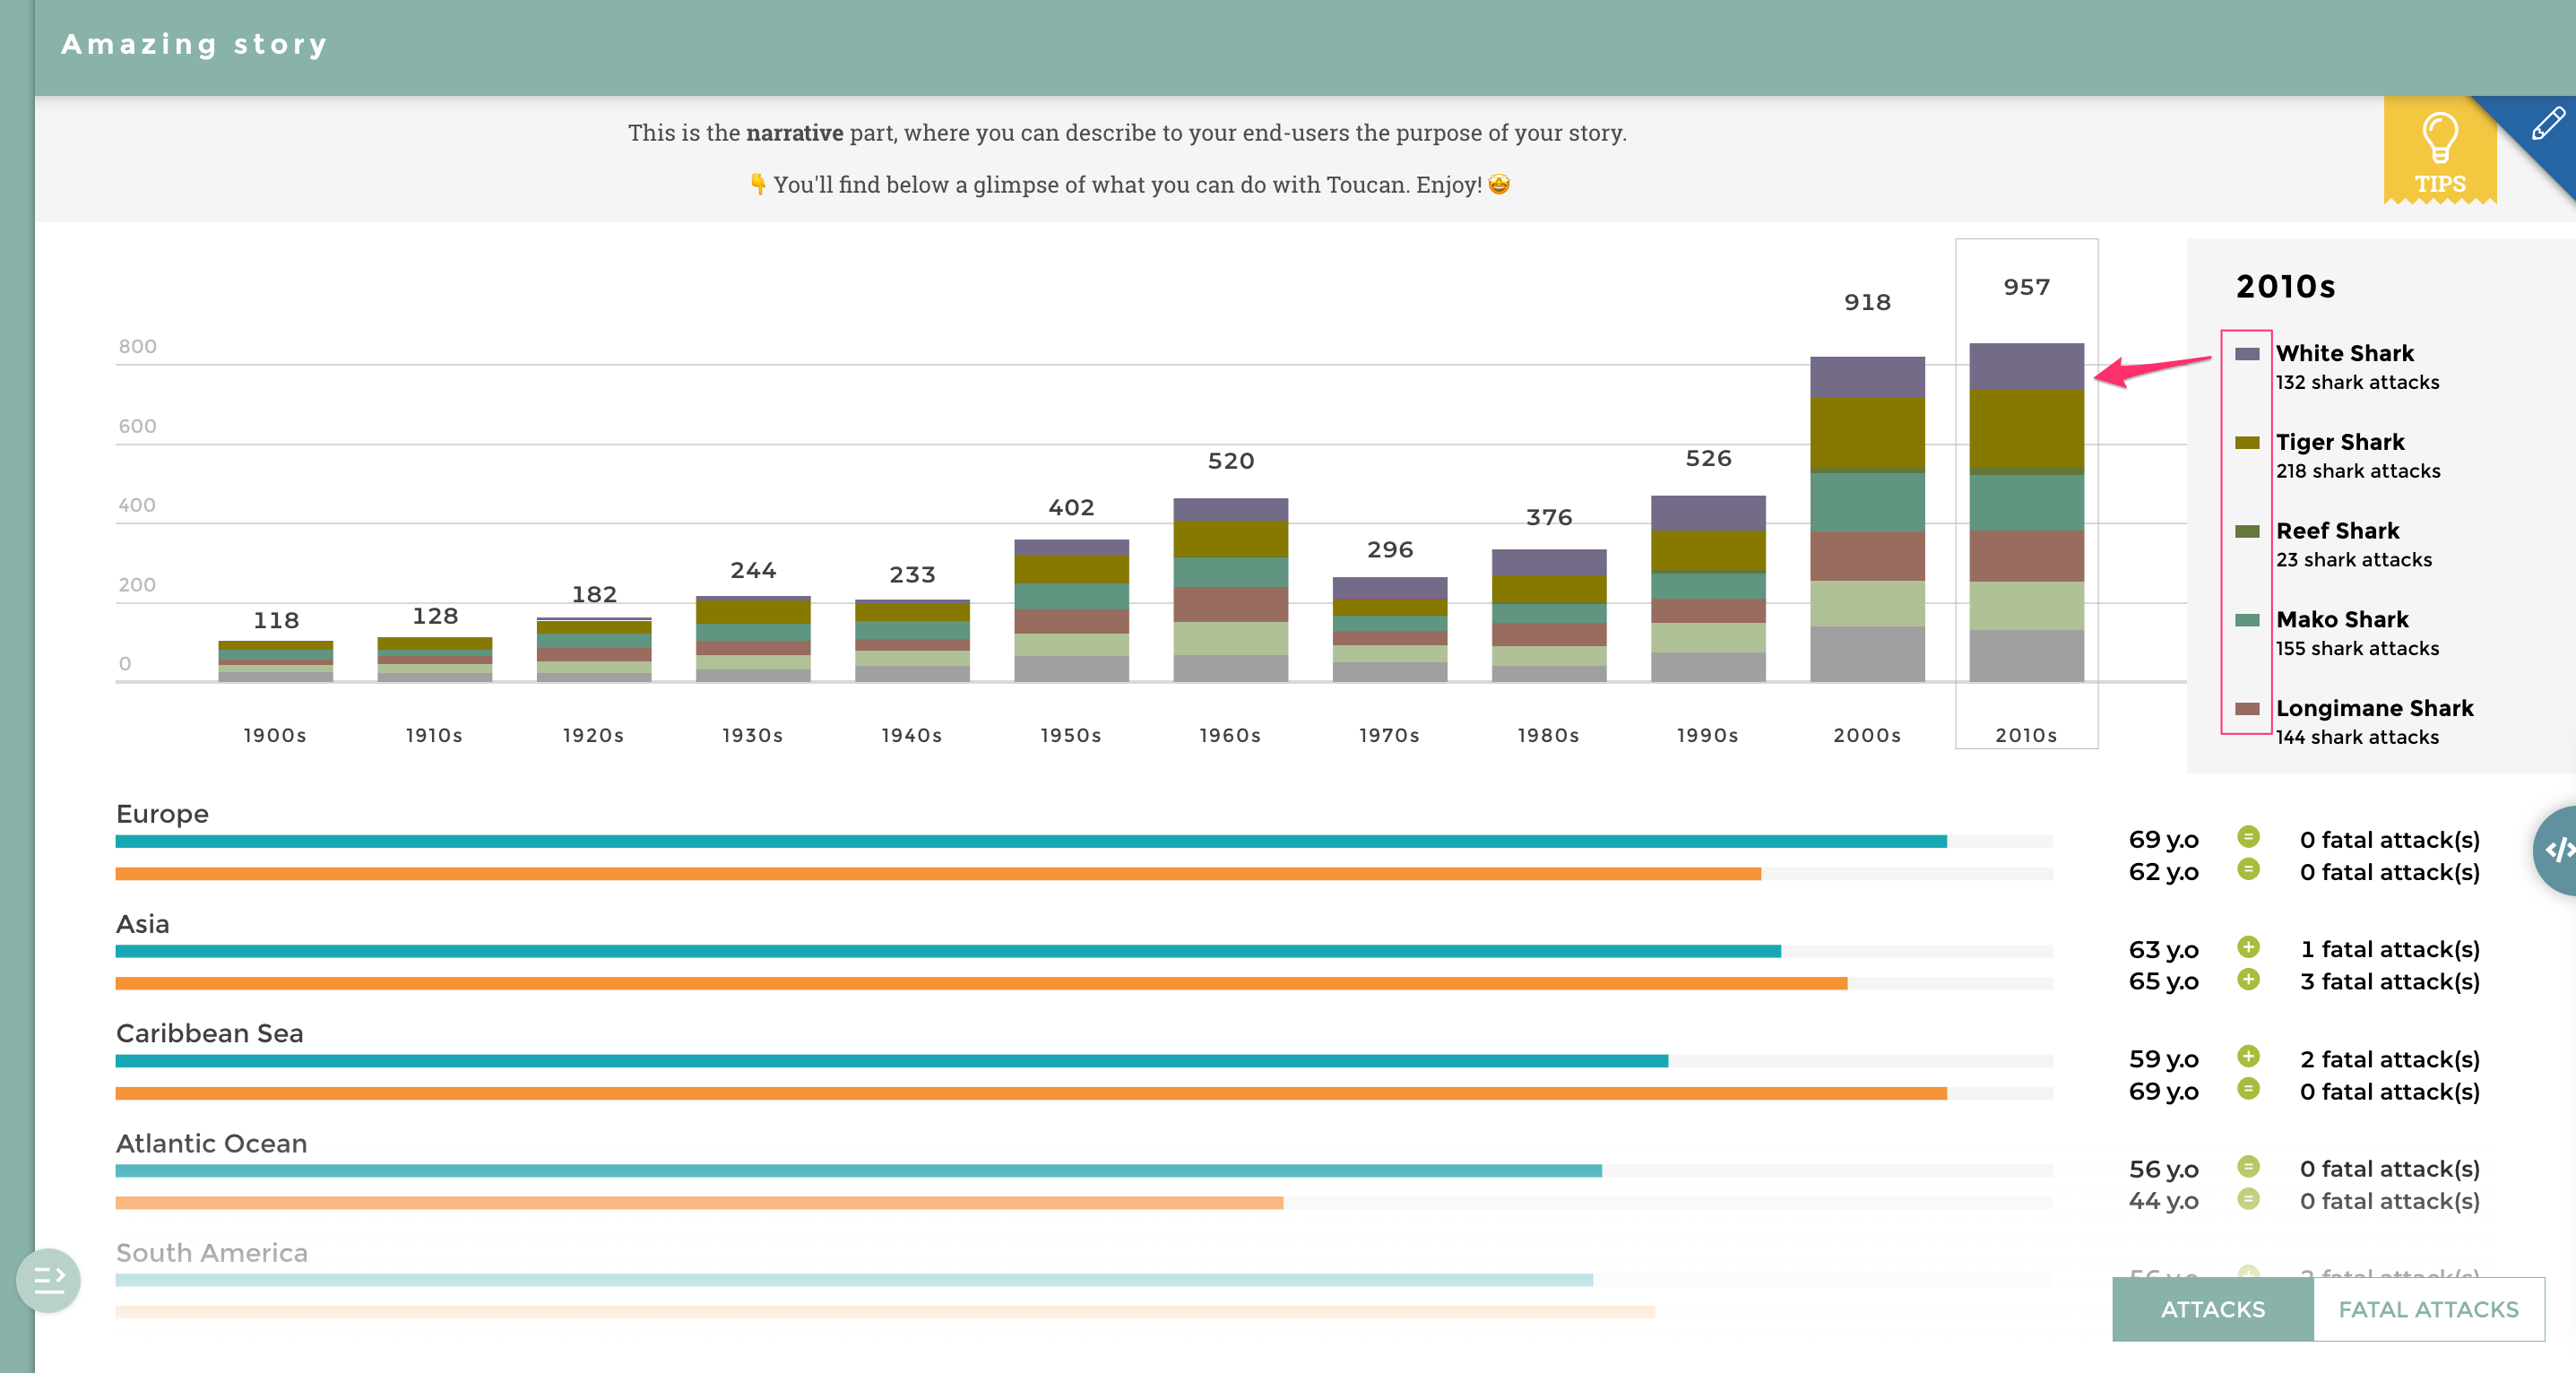
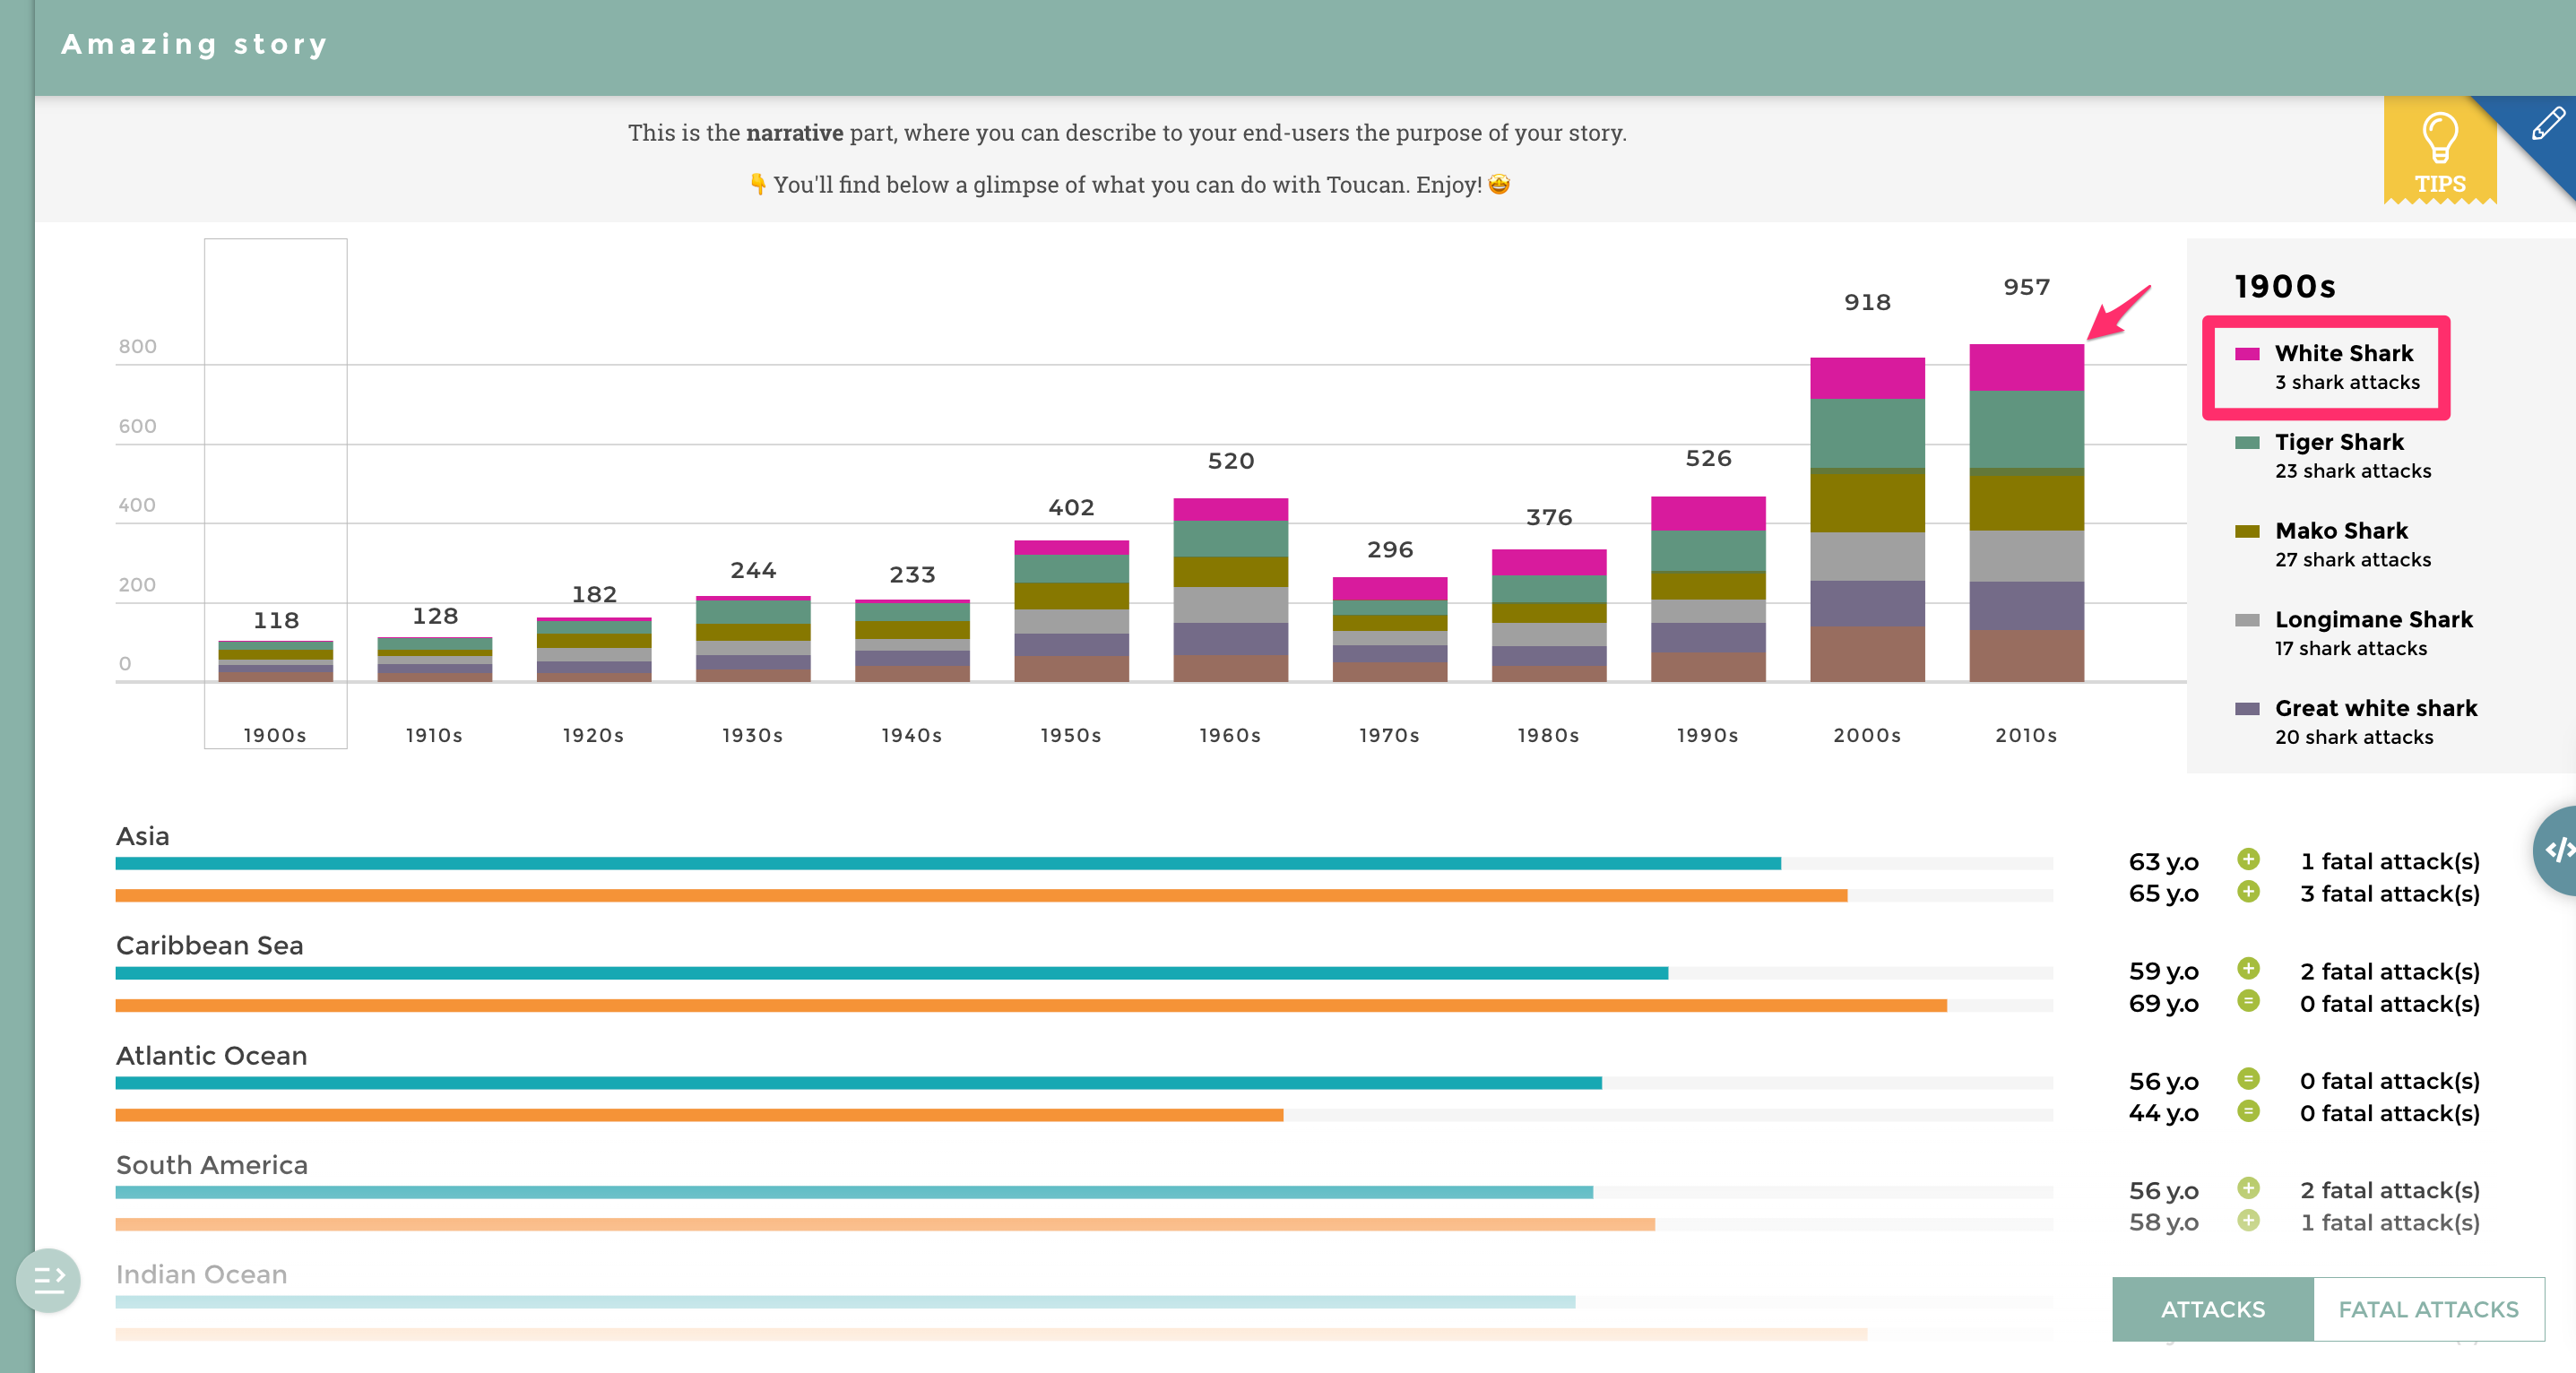
Each serie of the chart have its related color series that is applied. You see on the story above that the color serie #1 is defined for the first chart serie (Longimane Shark in this example), the color serie #2 is defined for the second chart serie (Mako Shark), etc. Note that the color serie number reflects the one of the legend, so if you are using the type of sharks in another story, depending on the order, it doesn’t mean that the “Longimane Shark” type will still have the color serie #1 applied. See another example below where “White shark” has the color serie #1 applied.
CheatSheet_ColorScheme_6
But don’t worry, if your need is to set-up a specific color for a specific label - or in other words if you want the Longimane Shark type to always have the same color through the entire Toucan app - we have a way to do that! Let’s see it right after the Scales colors. Below is another story example showing where you can see that the colors are applied depending on the Scale of the indicator. Here the number of research centers go from 5 to 20 so Toucan automatically applies the Quartile #1 color for research centers between [5-8], Quartile #2 color for research center between [8-11] and so on. You don’t even have to define the scale, Toucan does its magic for you! Quite useful, isn’t it? Of course, if you want to set-up your own sentiment - in other words, regions that under 8 research centers should be negative, those that have between 8 and 11 should be neutral, and so on - you can still personalize it and then Toucan won’t use the Scales colors anymore, but those of the sentiment defined in the Highlights as seen before.

CheatSheet_ColorScheme_7
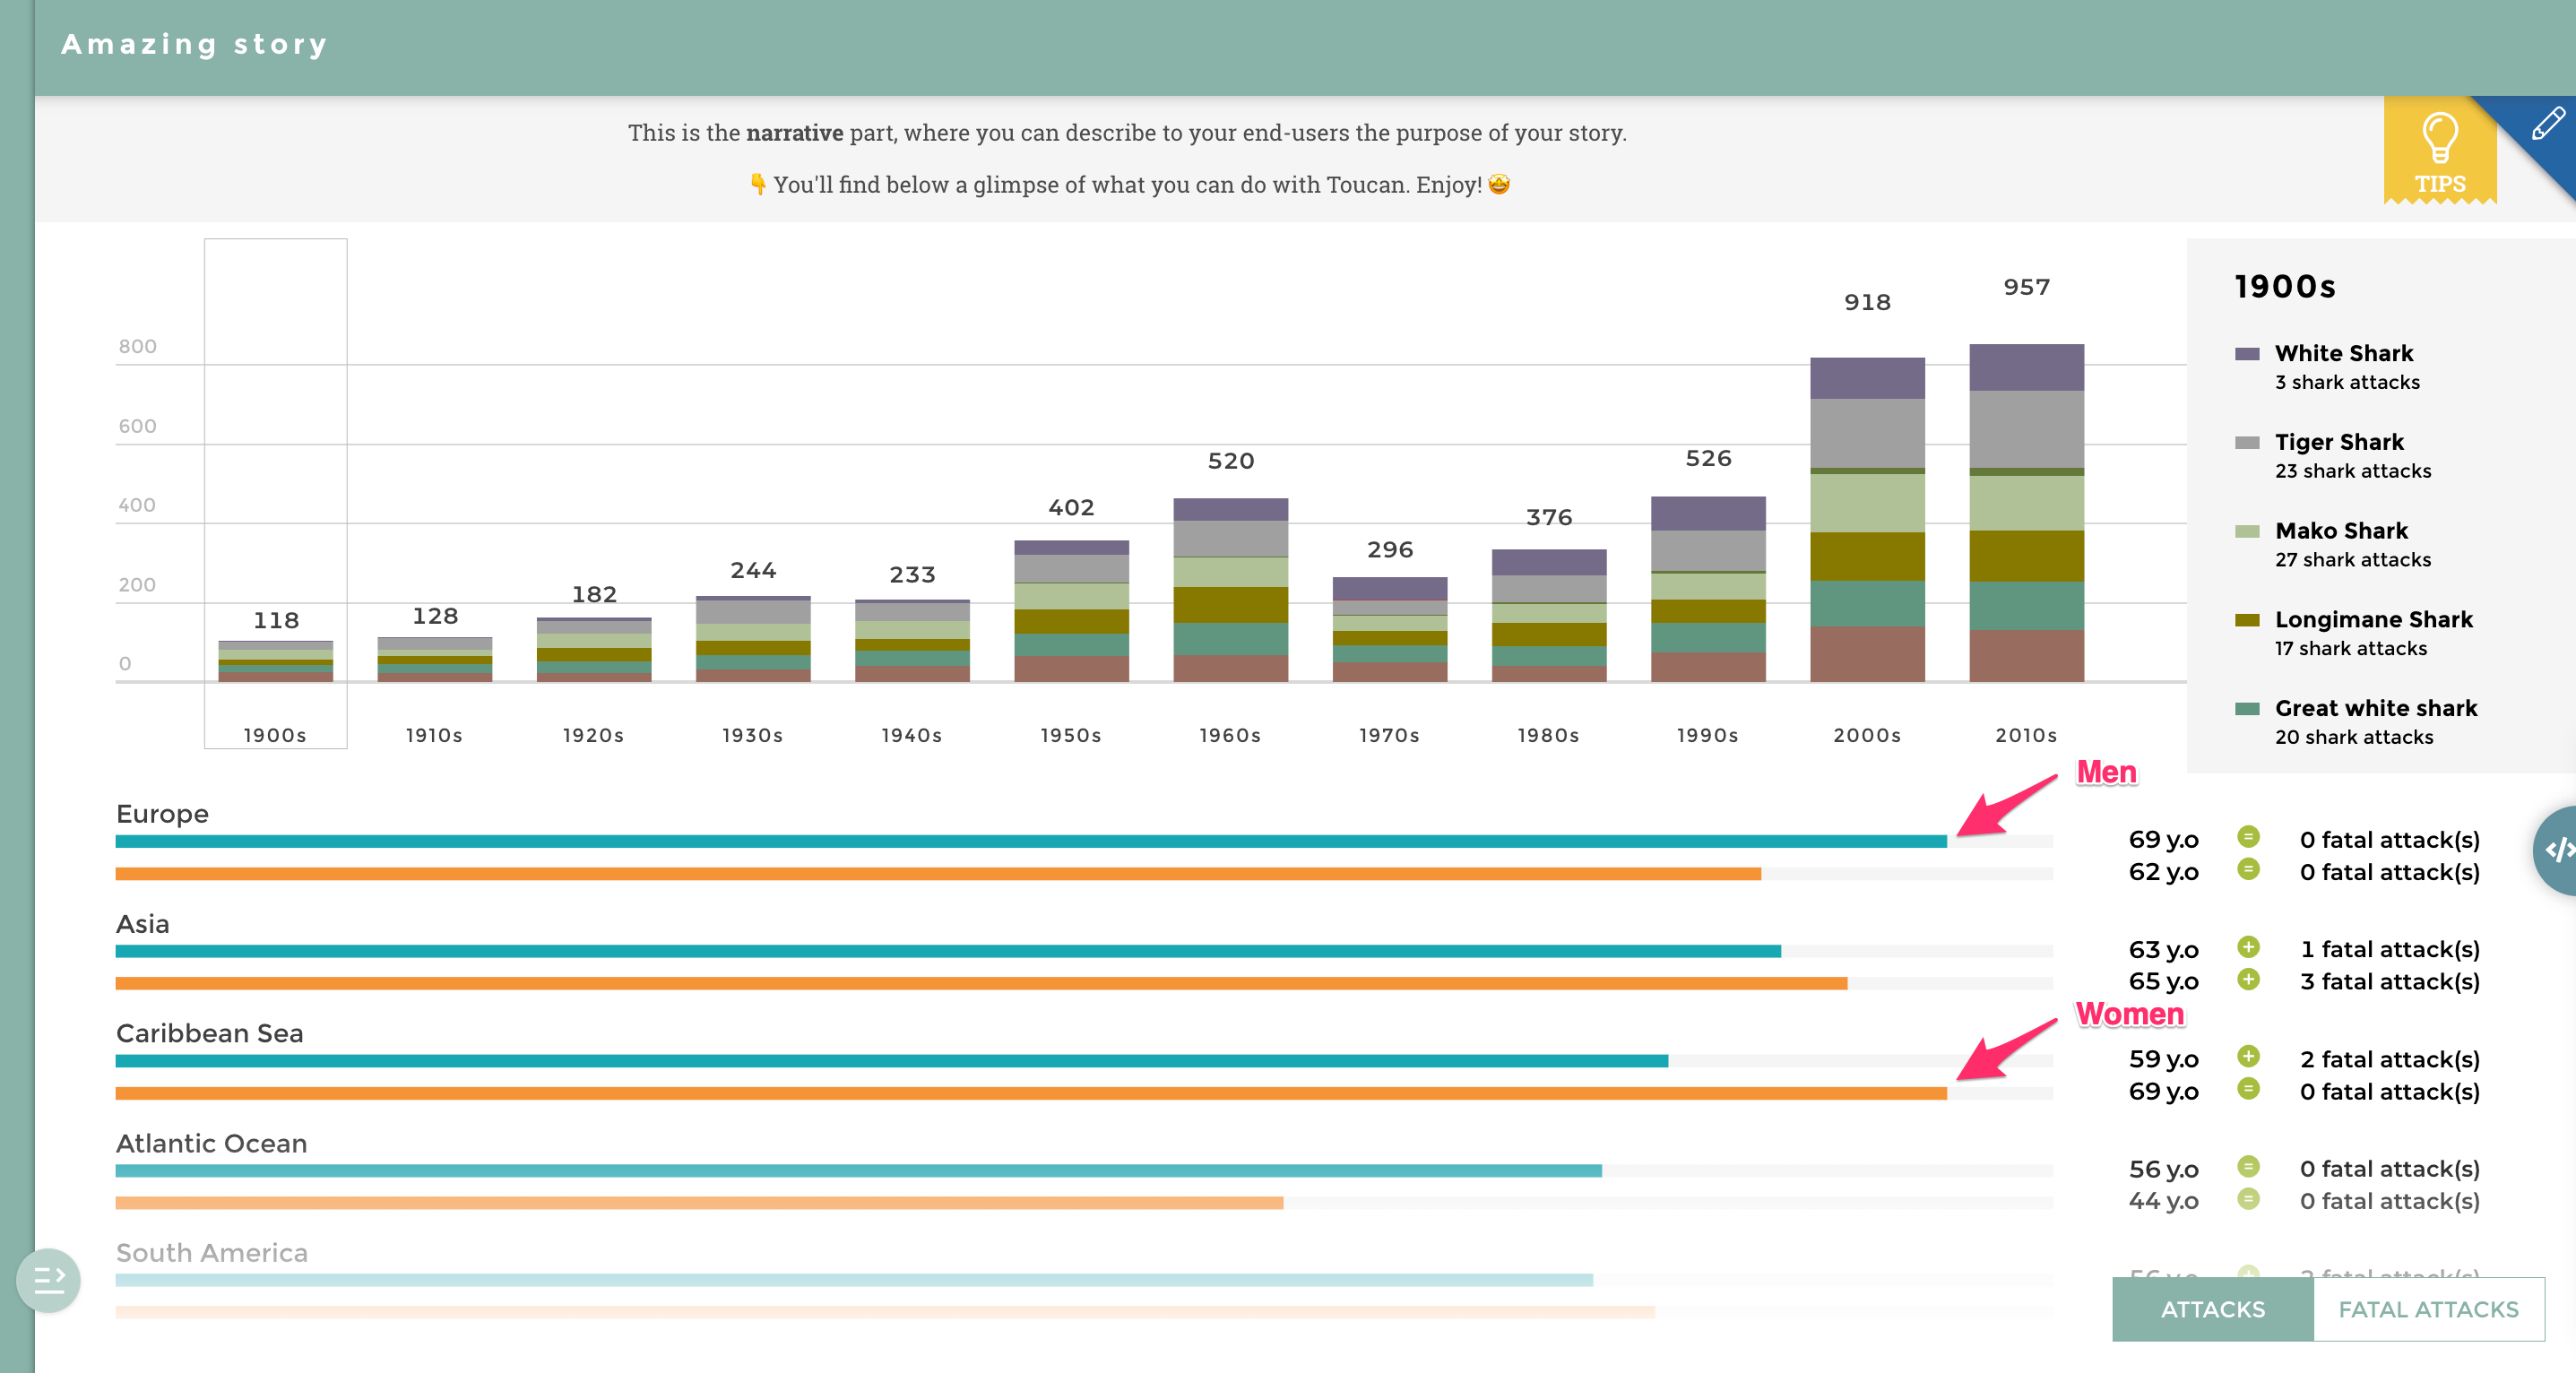
We are now going to see the last section, the Series colors. Let’s take back our previous story example and pay attention to the secondary chart, the leaderboard that shows the age in average of men and women who have been attacked by zones. You see that we defined a specific color for one specific serie:
- Blue for Men
- Orange for Women
It means that everytime you’ll be using these specific series, the colors you chose will apply in the entire application.
CheatSheet_ColorScheme_8
So if you want the White Shark type to always be in pink for example, you can write it in the Series color as shown below:
CheatSheet_ColorScheme_9
And here is what you will get:
CheatSheet_ColorScheme_10
Well done! You are now a Toucan color expert 🎨